


Return to the main Gallery page.
The photos below show sample figures of data obtained from using the departmental XRD.
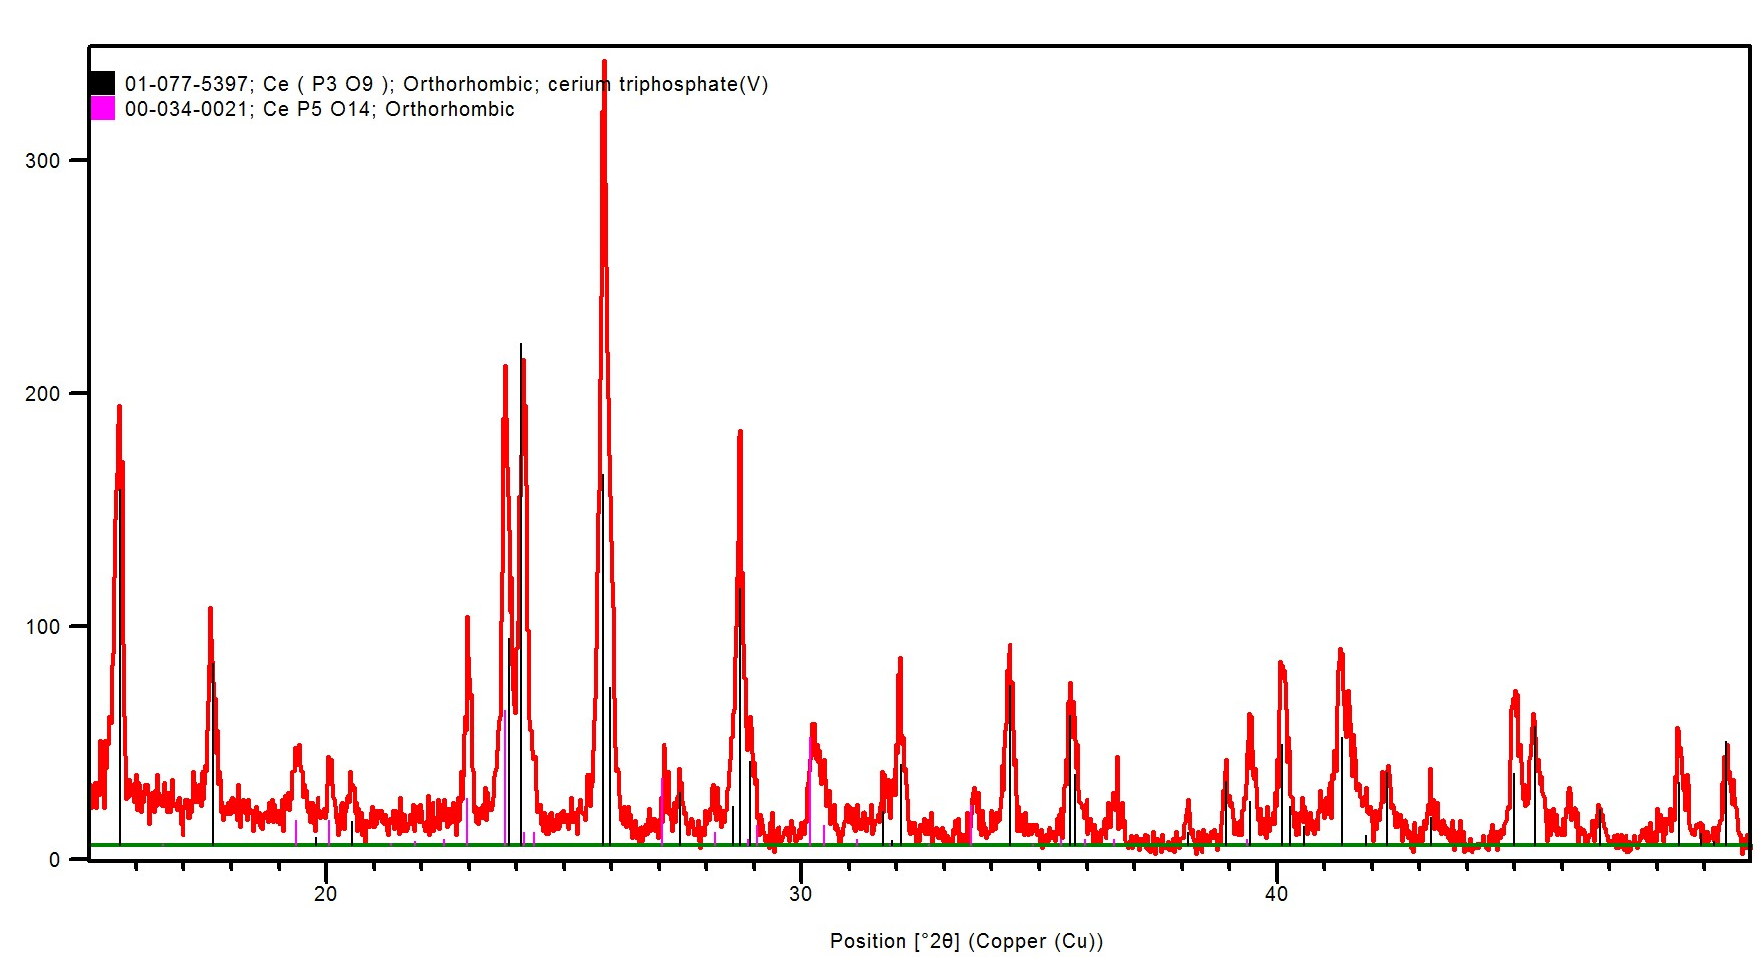
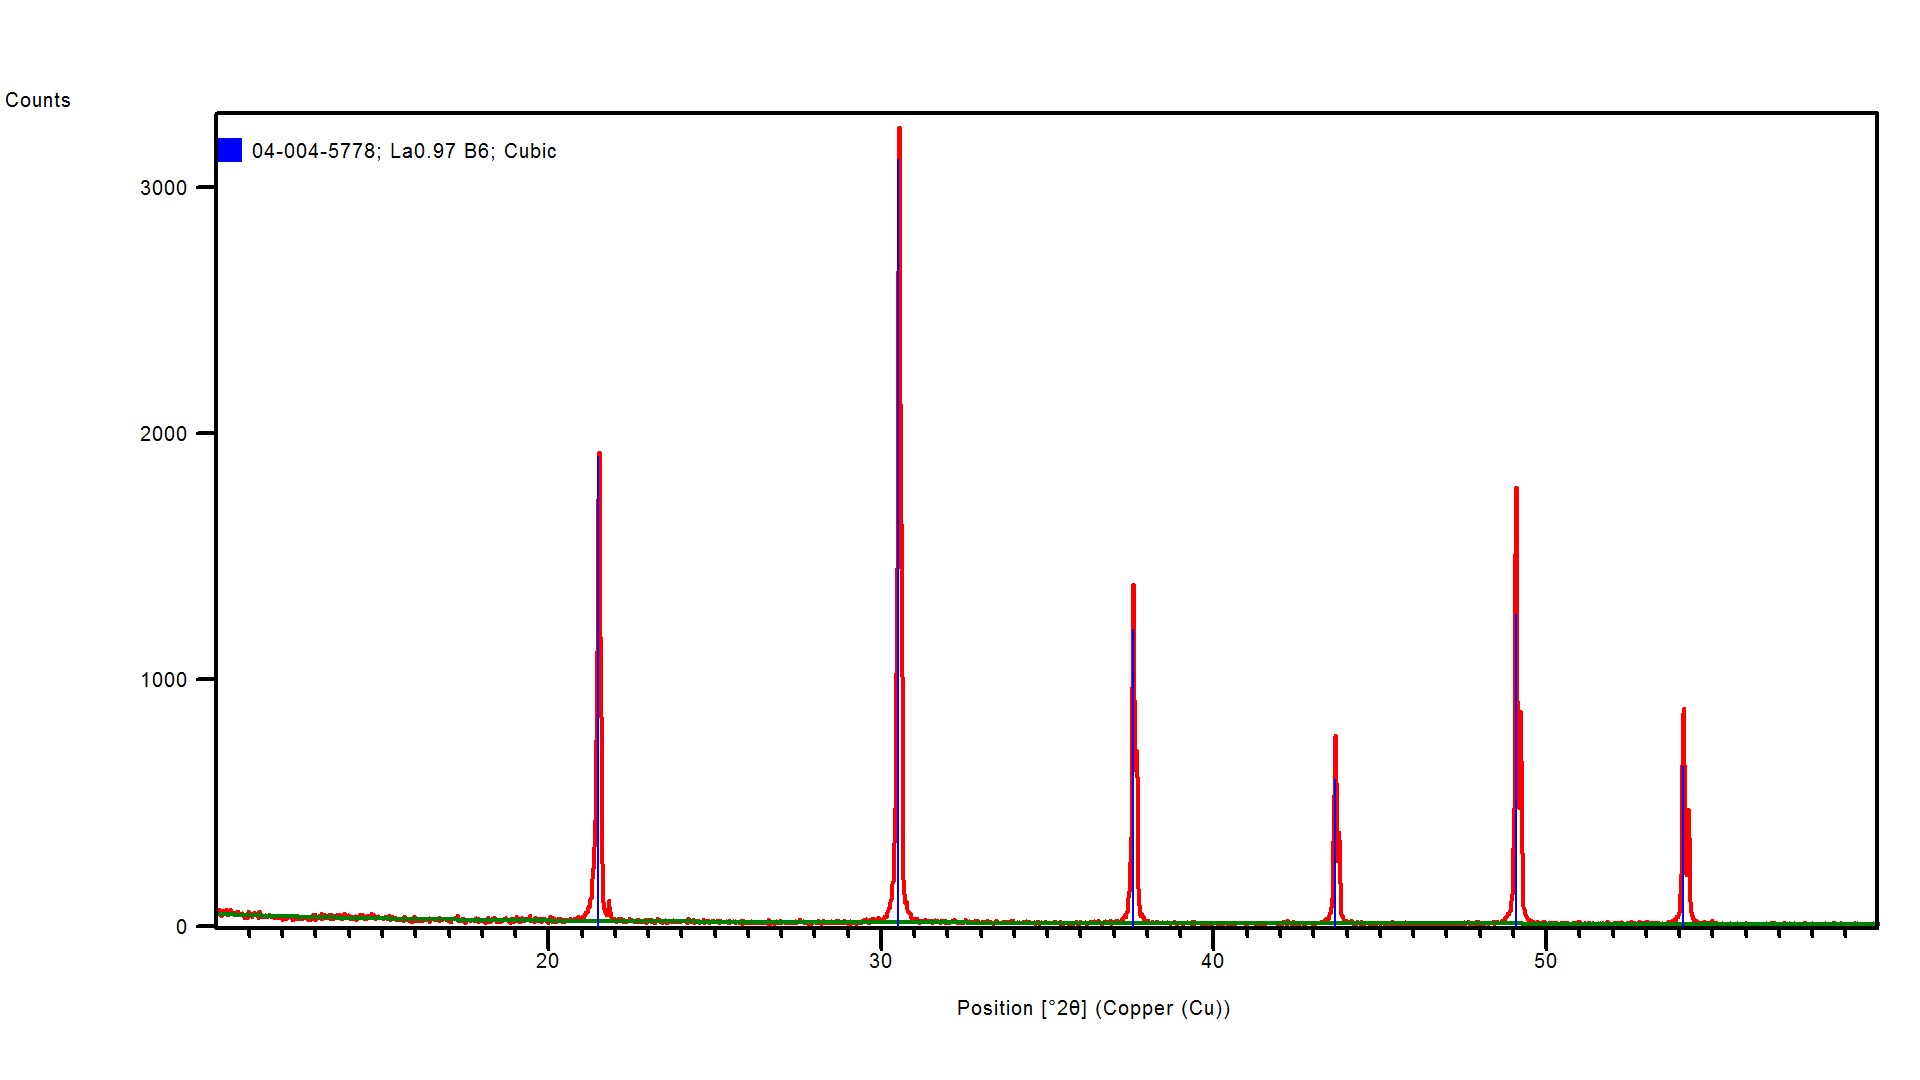
1. Phase Identification
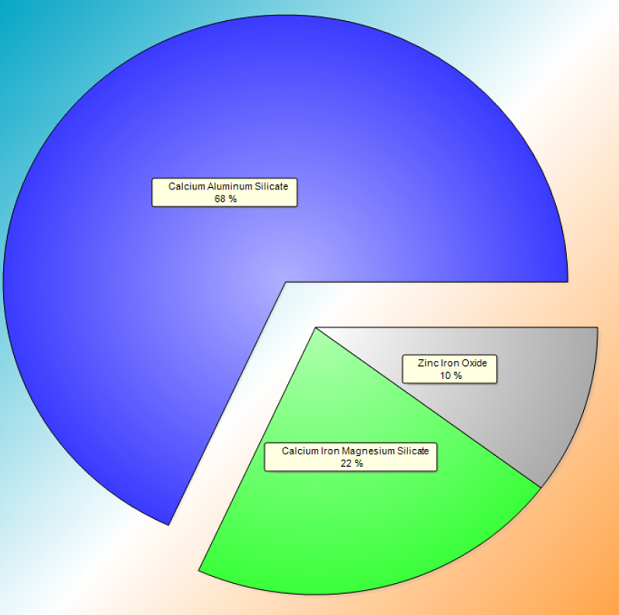
2. Phase Quantification
a. Relative Intensity Ratio (RIR, for certain phases)
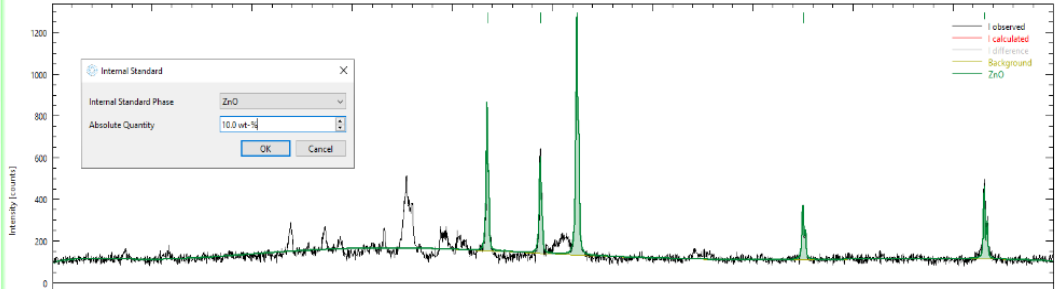
b. Internal Standard (added into unknown samples at known ratios)
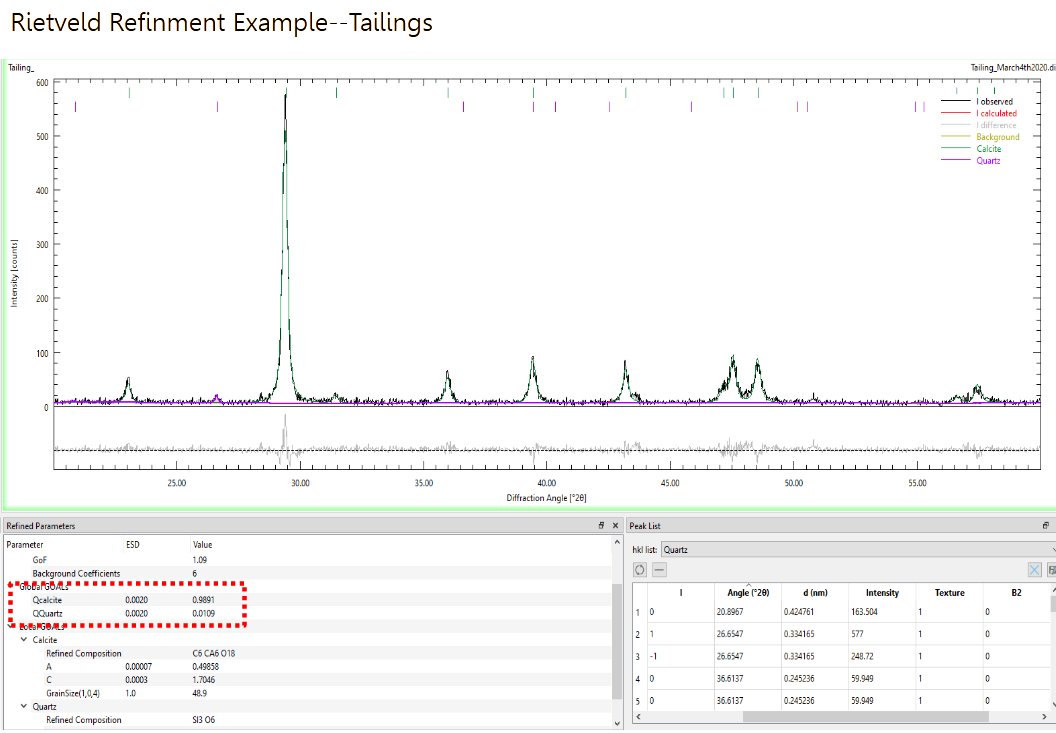
c. Rietvield Refinement (third party software)
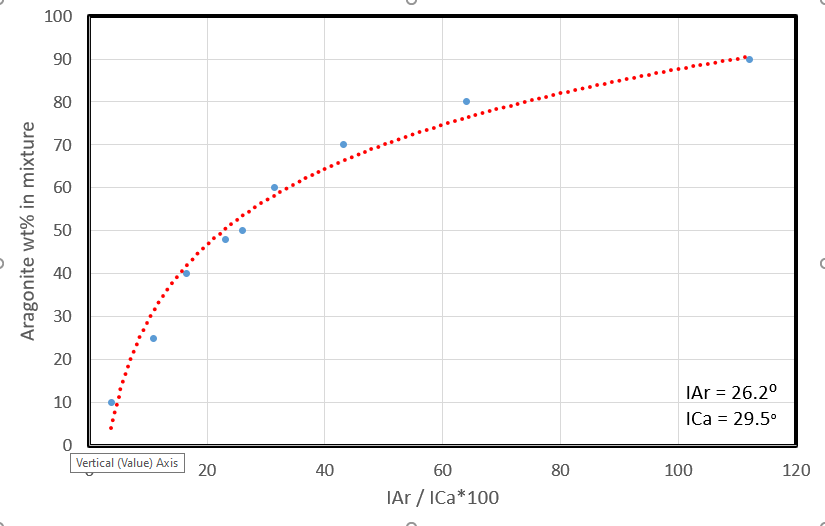
d. Calibration curve (simple systems with end member standards)
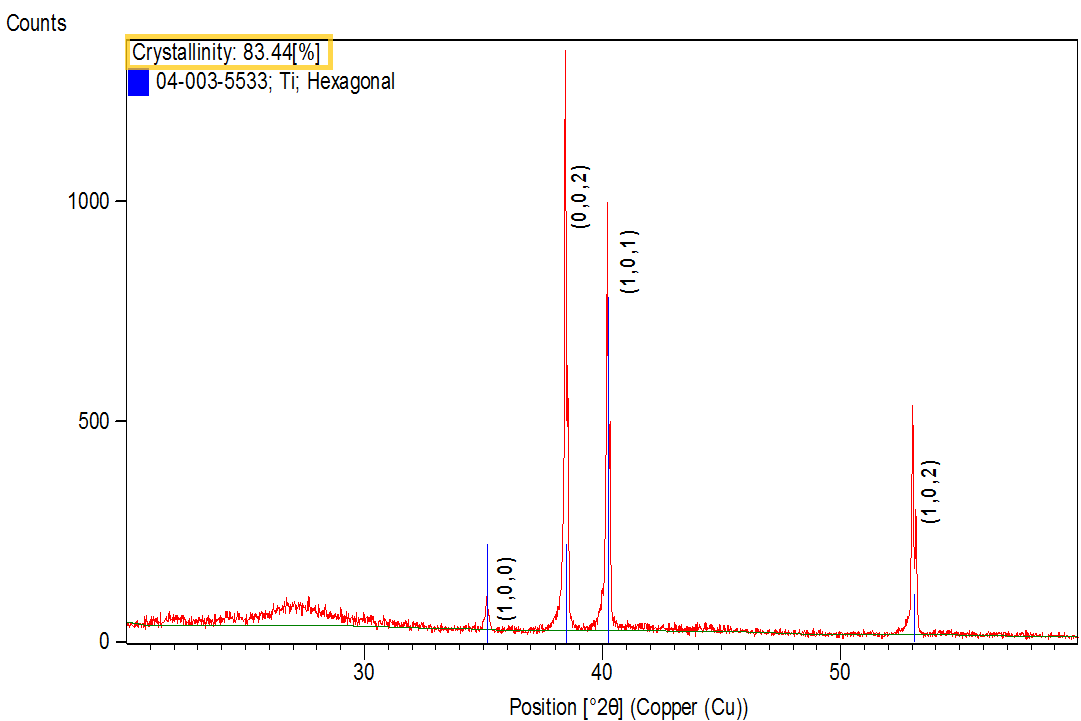
3. Crystallinity
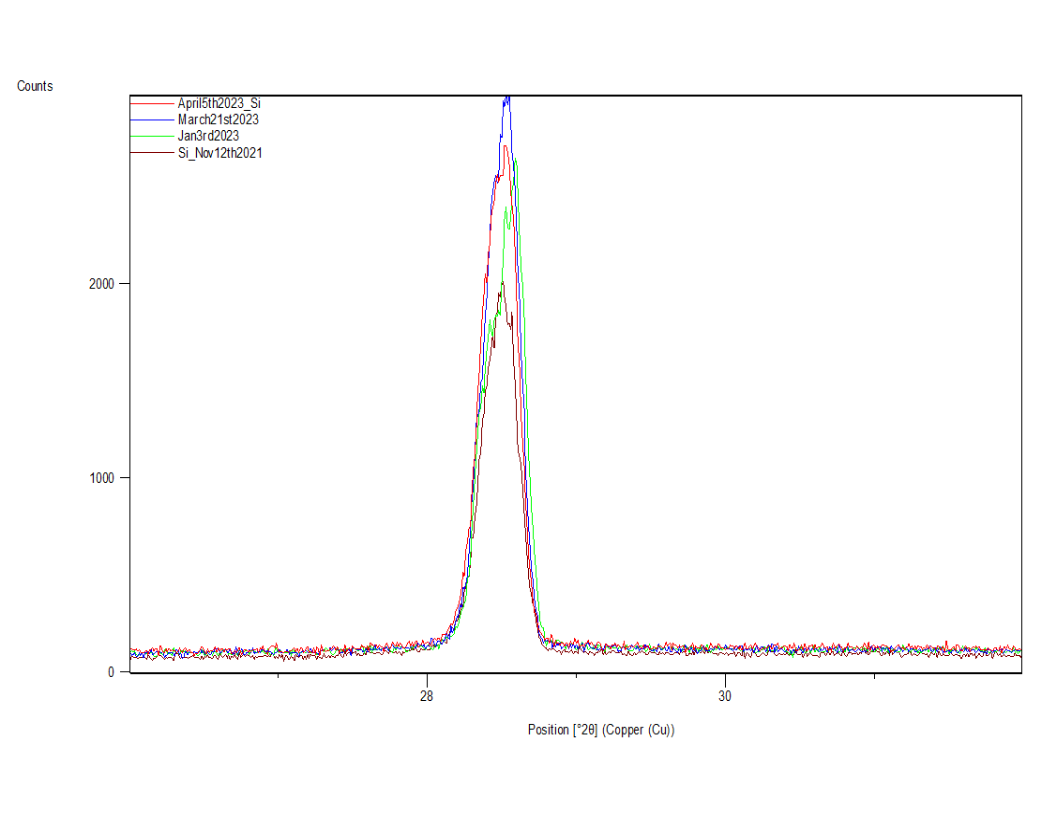
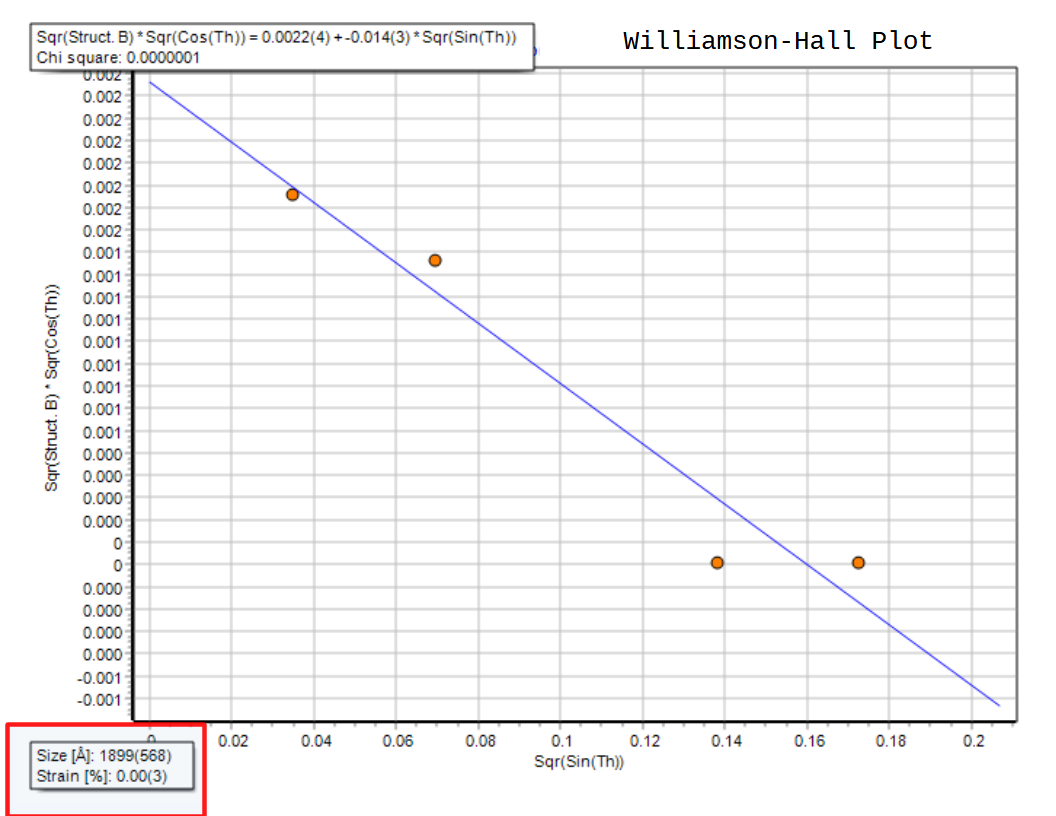
4. Crystallite Size and Strain Estimates
Return to the main Gallery page.