

Return to the main Gallery page.
The photos below show the imaging capabilities as well as the range of data that can be acquired from using our departmental EPMA. For more information about specific functions of the machine, please consult the technician (Dr. Yanan Liu).
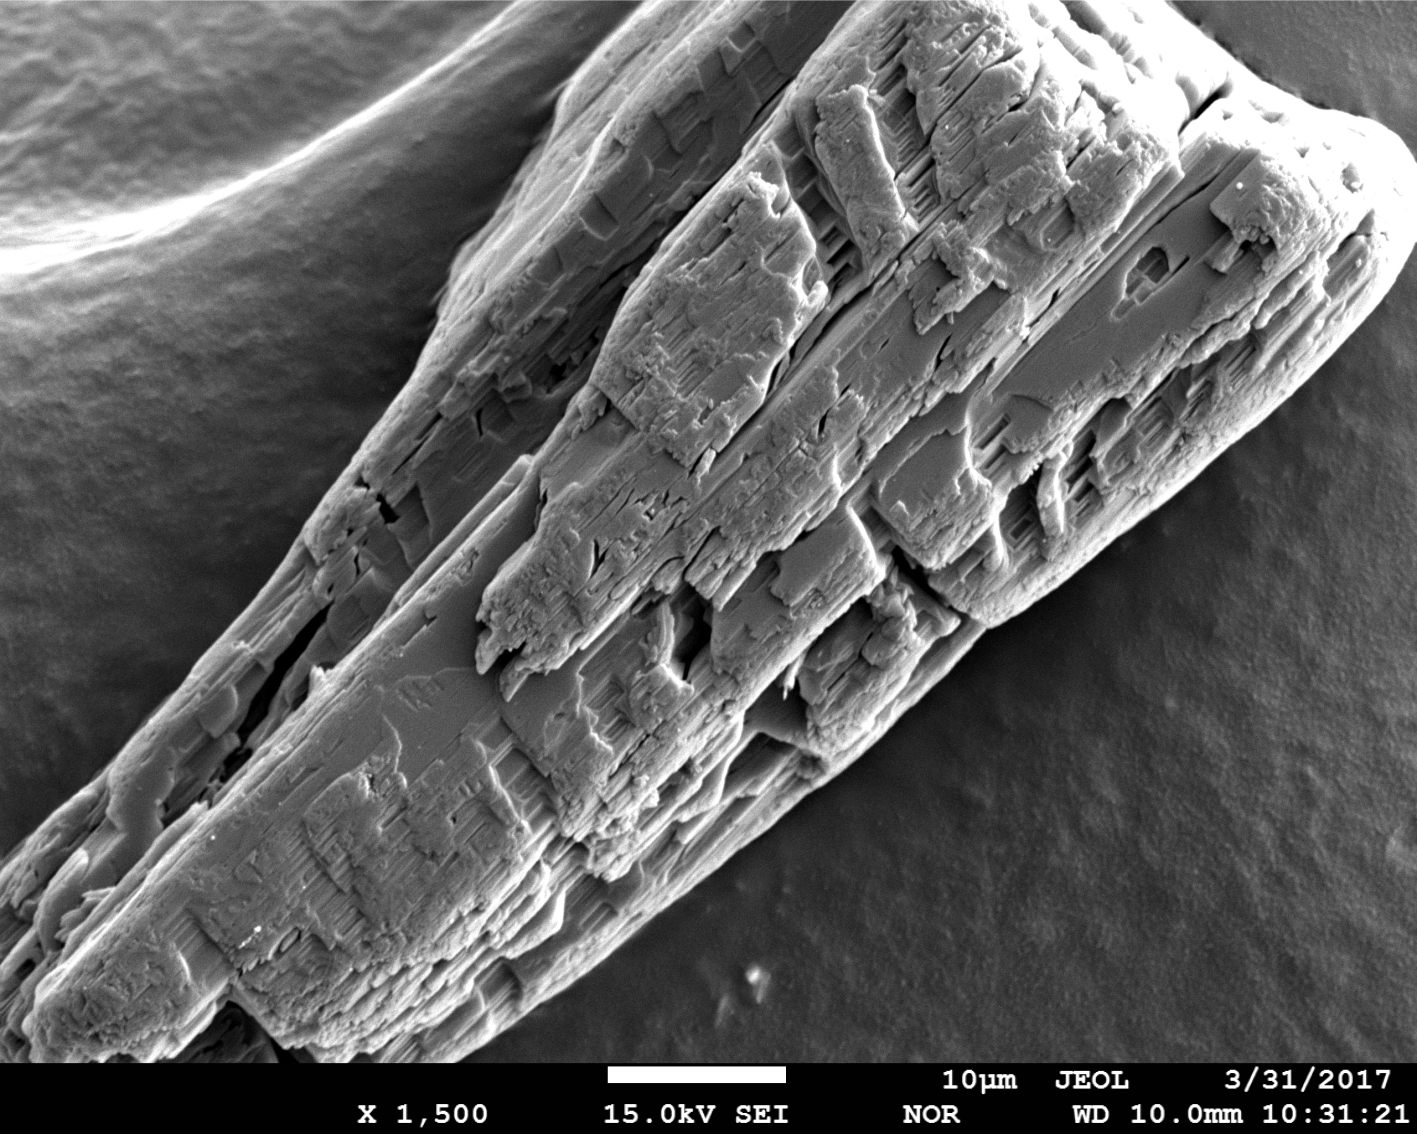
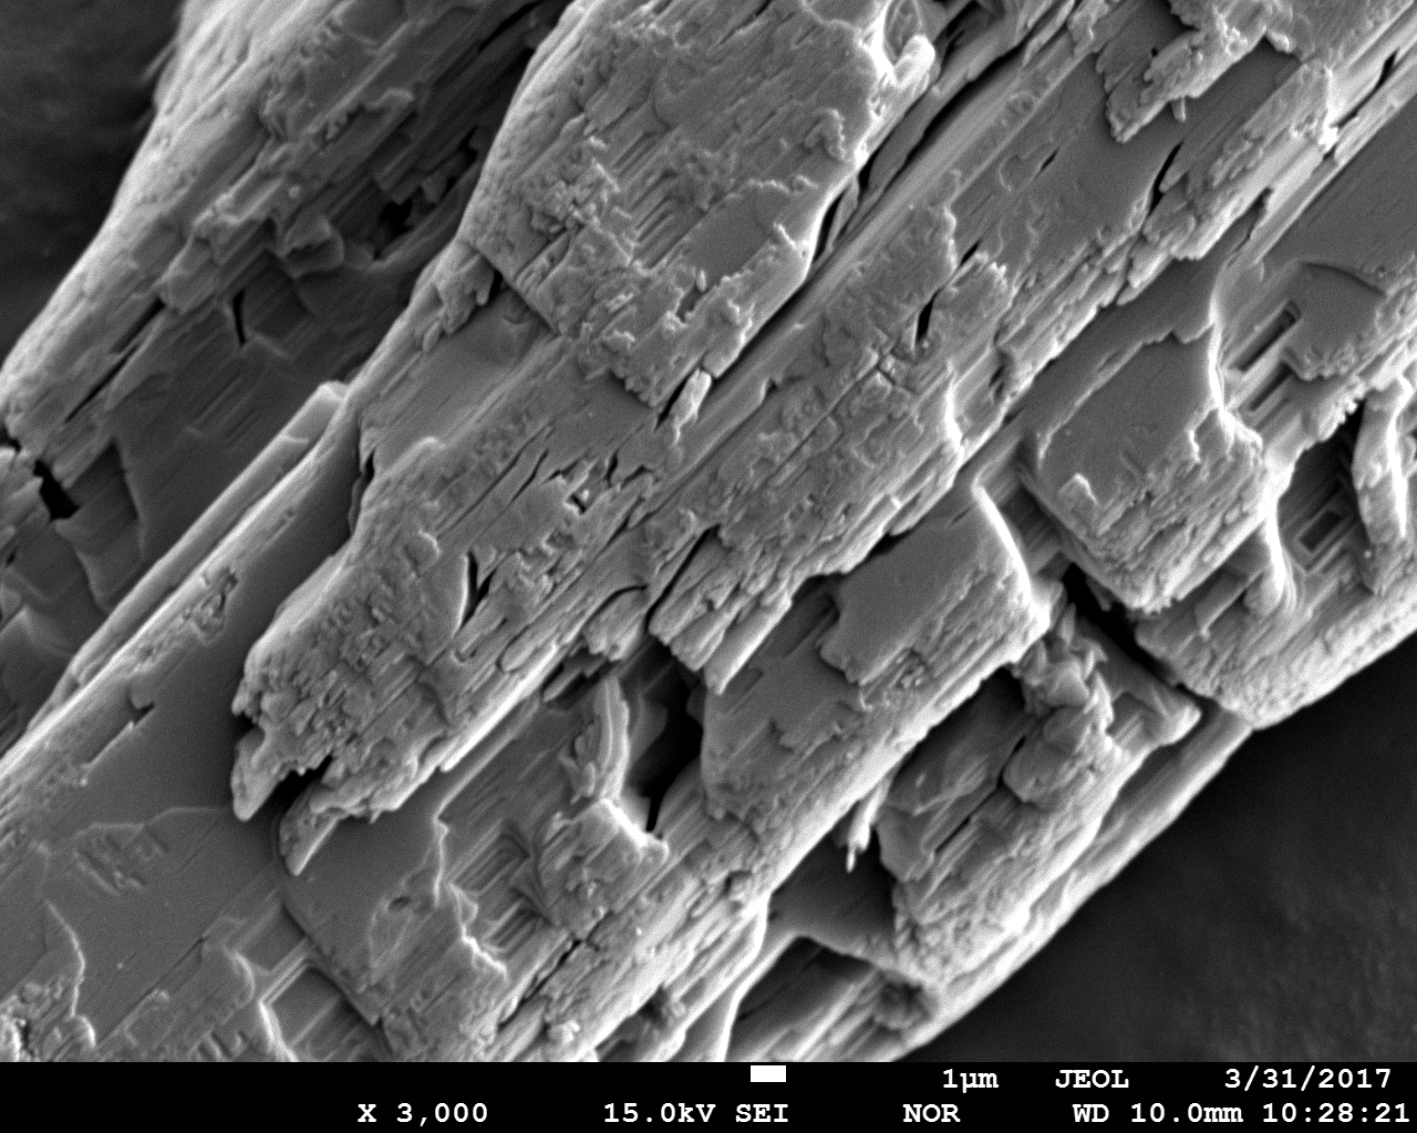
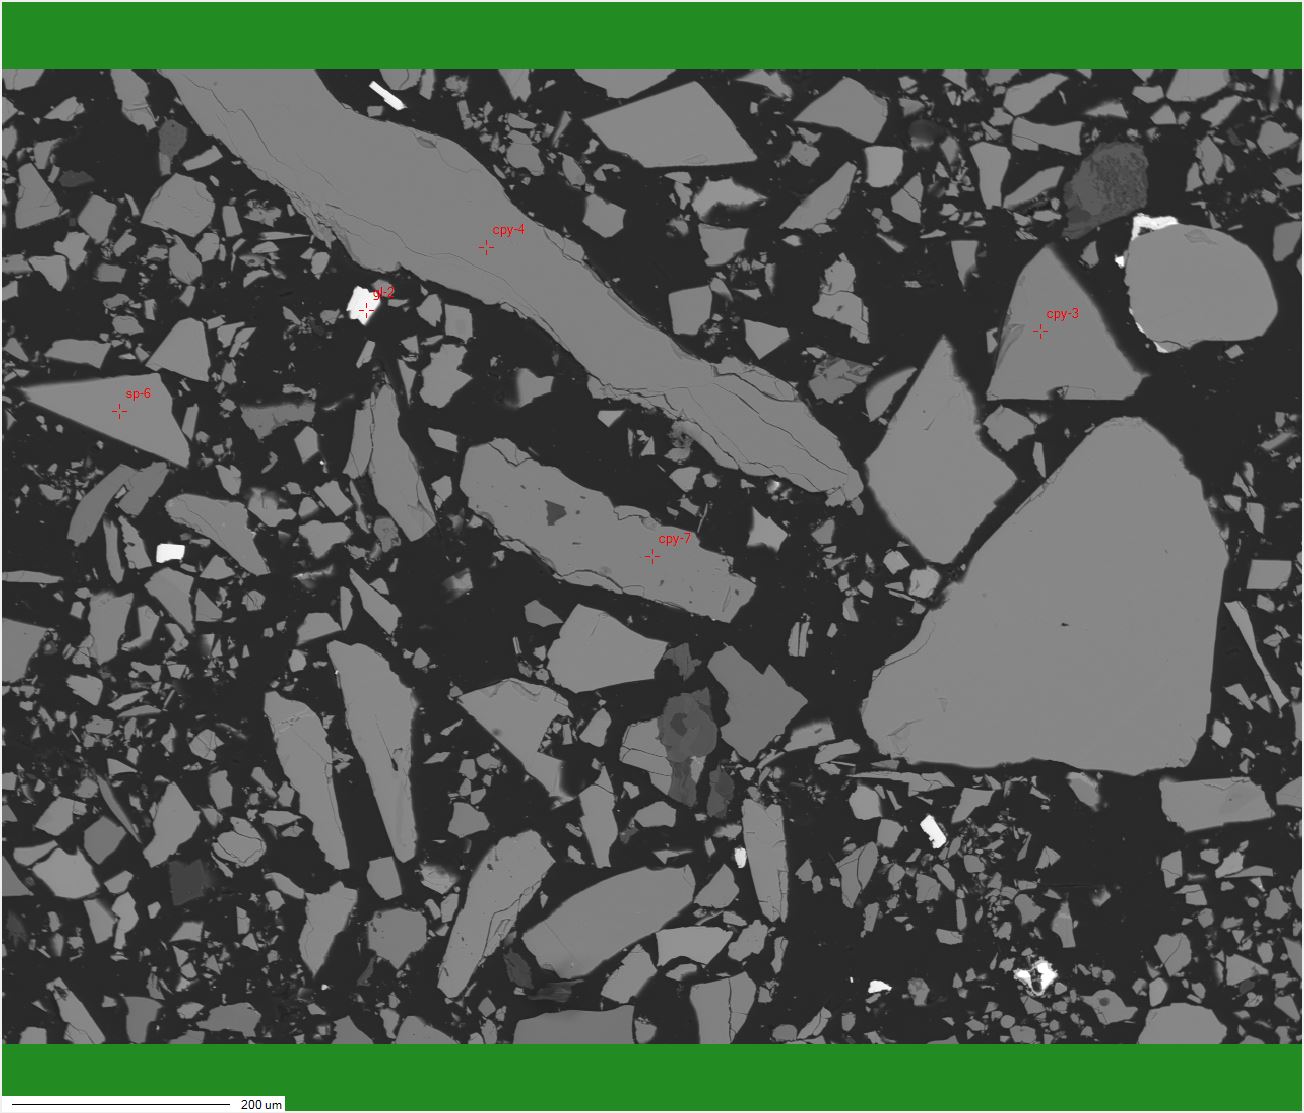
1. Examples of SEI Imaging
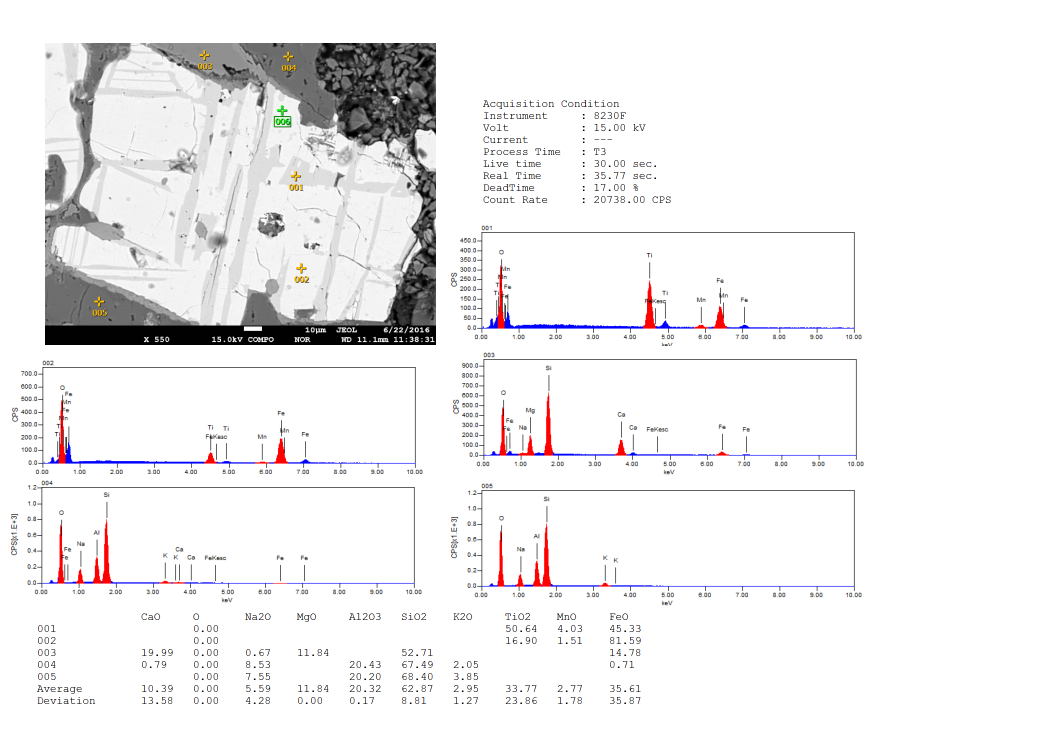
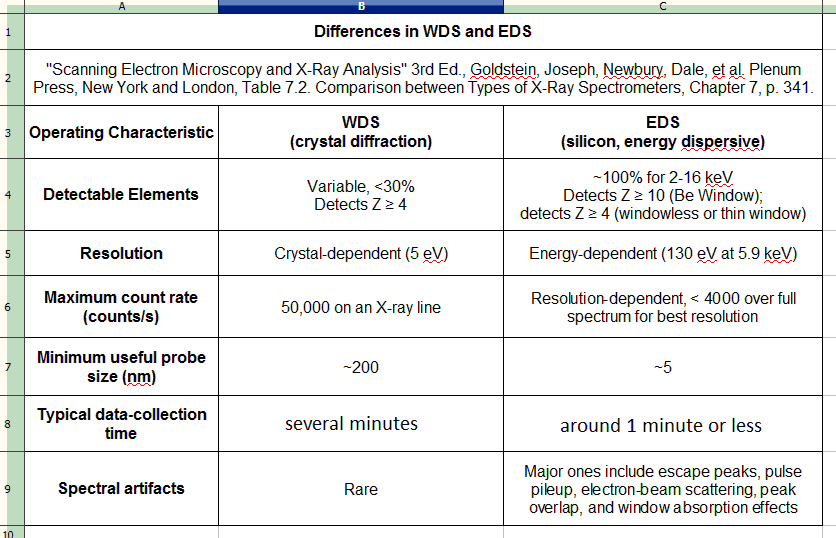
2. Examples of Energy Dispersive Spectrometer (EDS) Qualitative and Quantitative Analysis
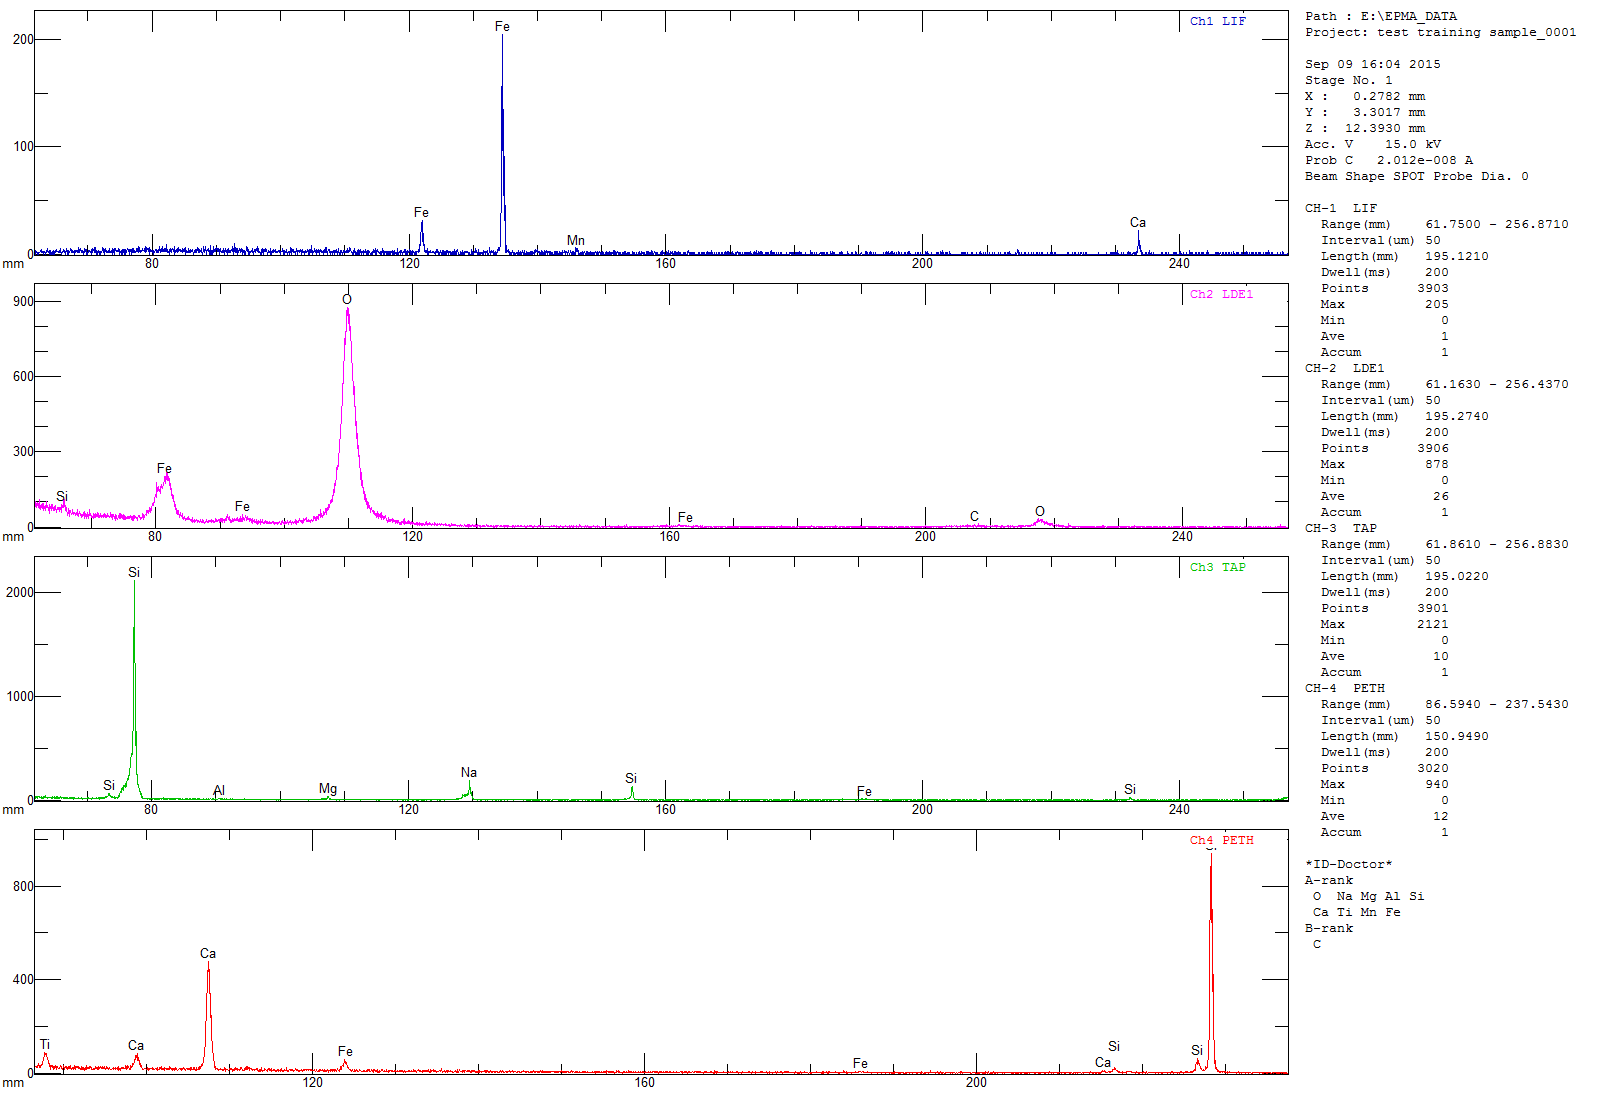
3. Examples of Wavelength Dispersive Spectrometer (WDS) Qualitative Analysis (Wavescan)
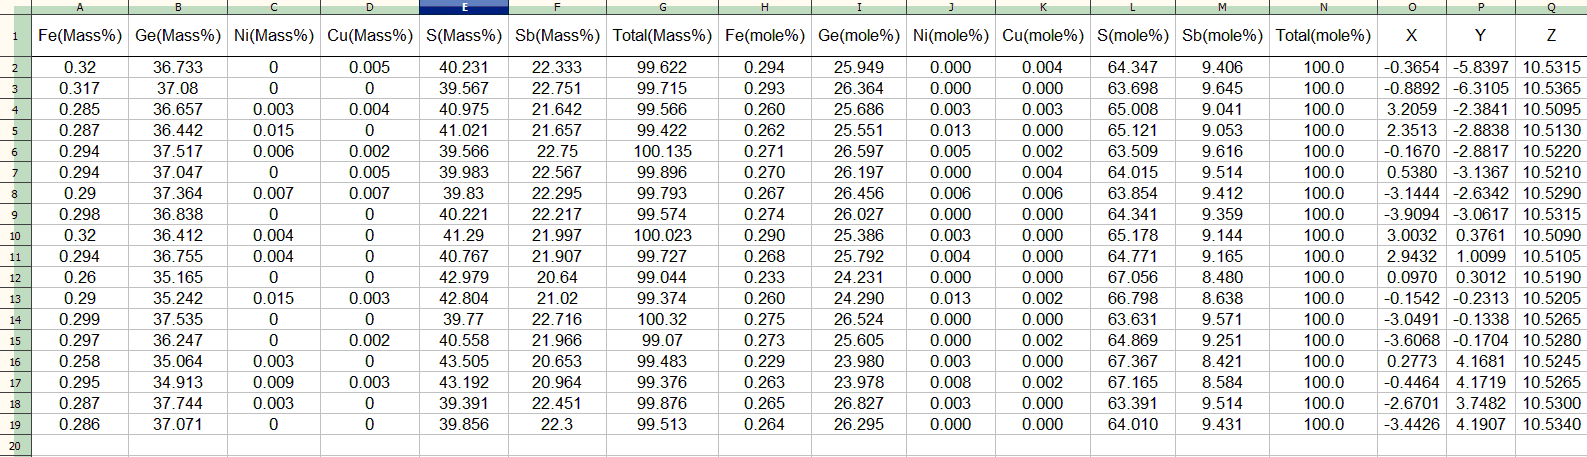
4. Example of WDS Quantitative Analysis
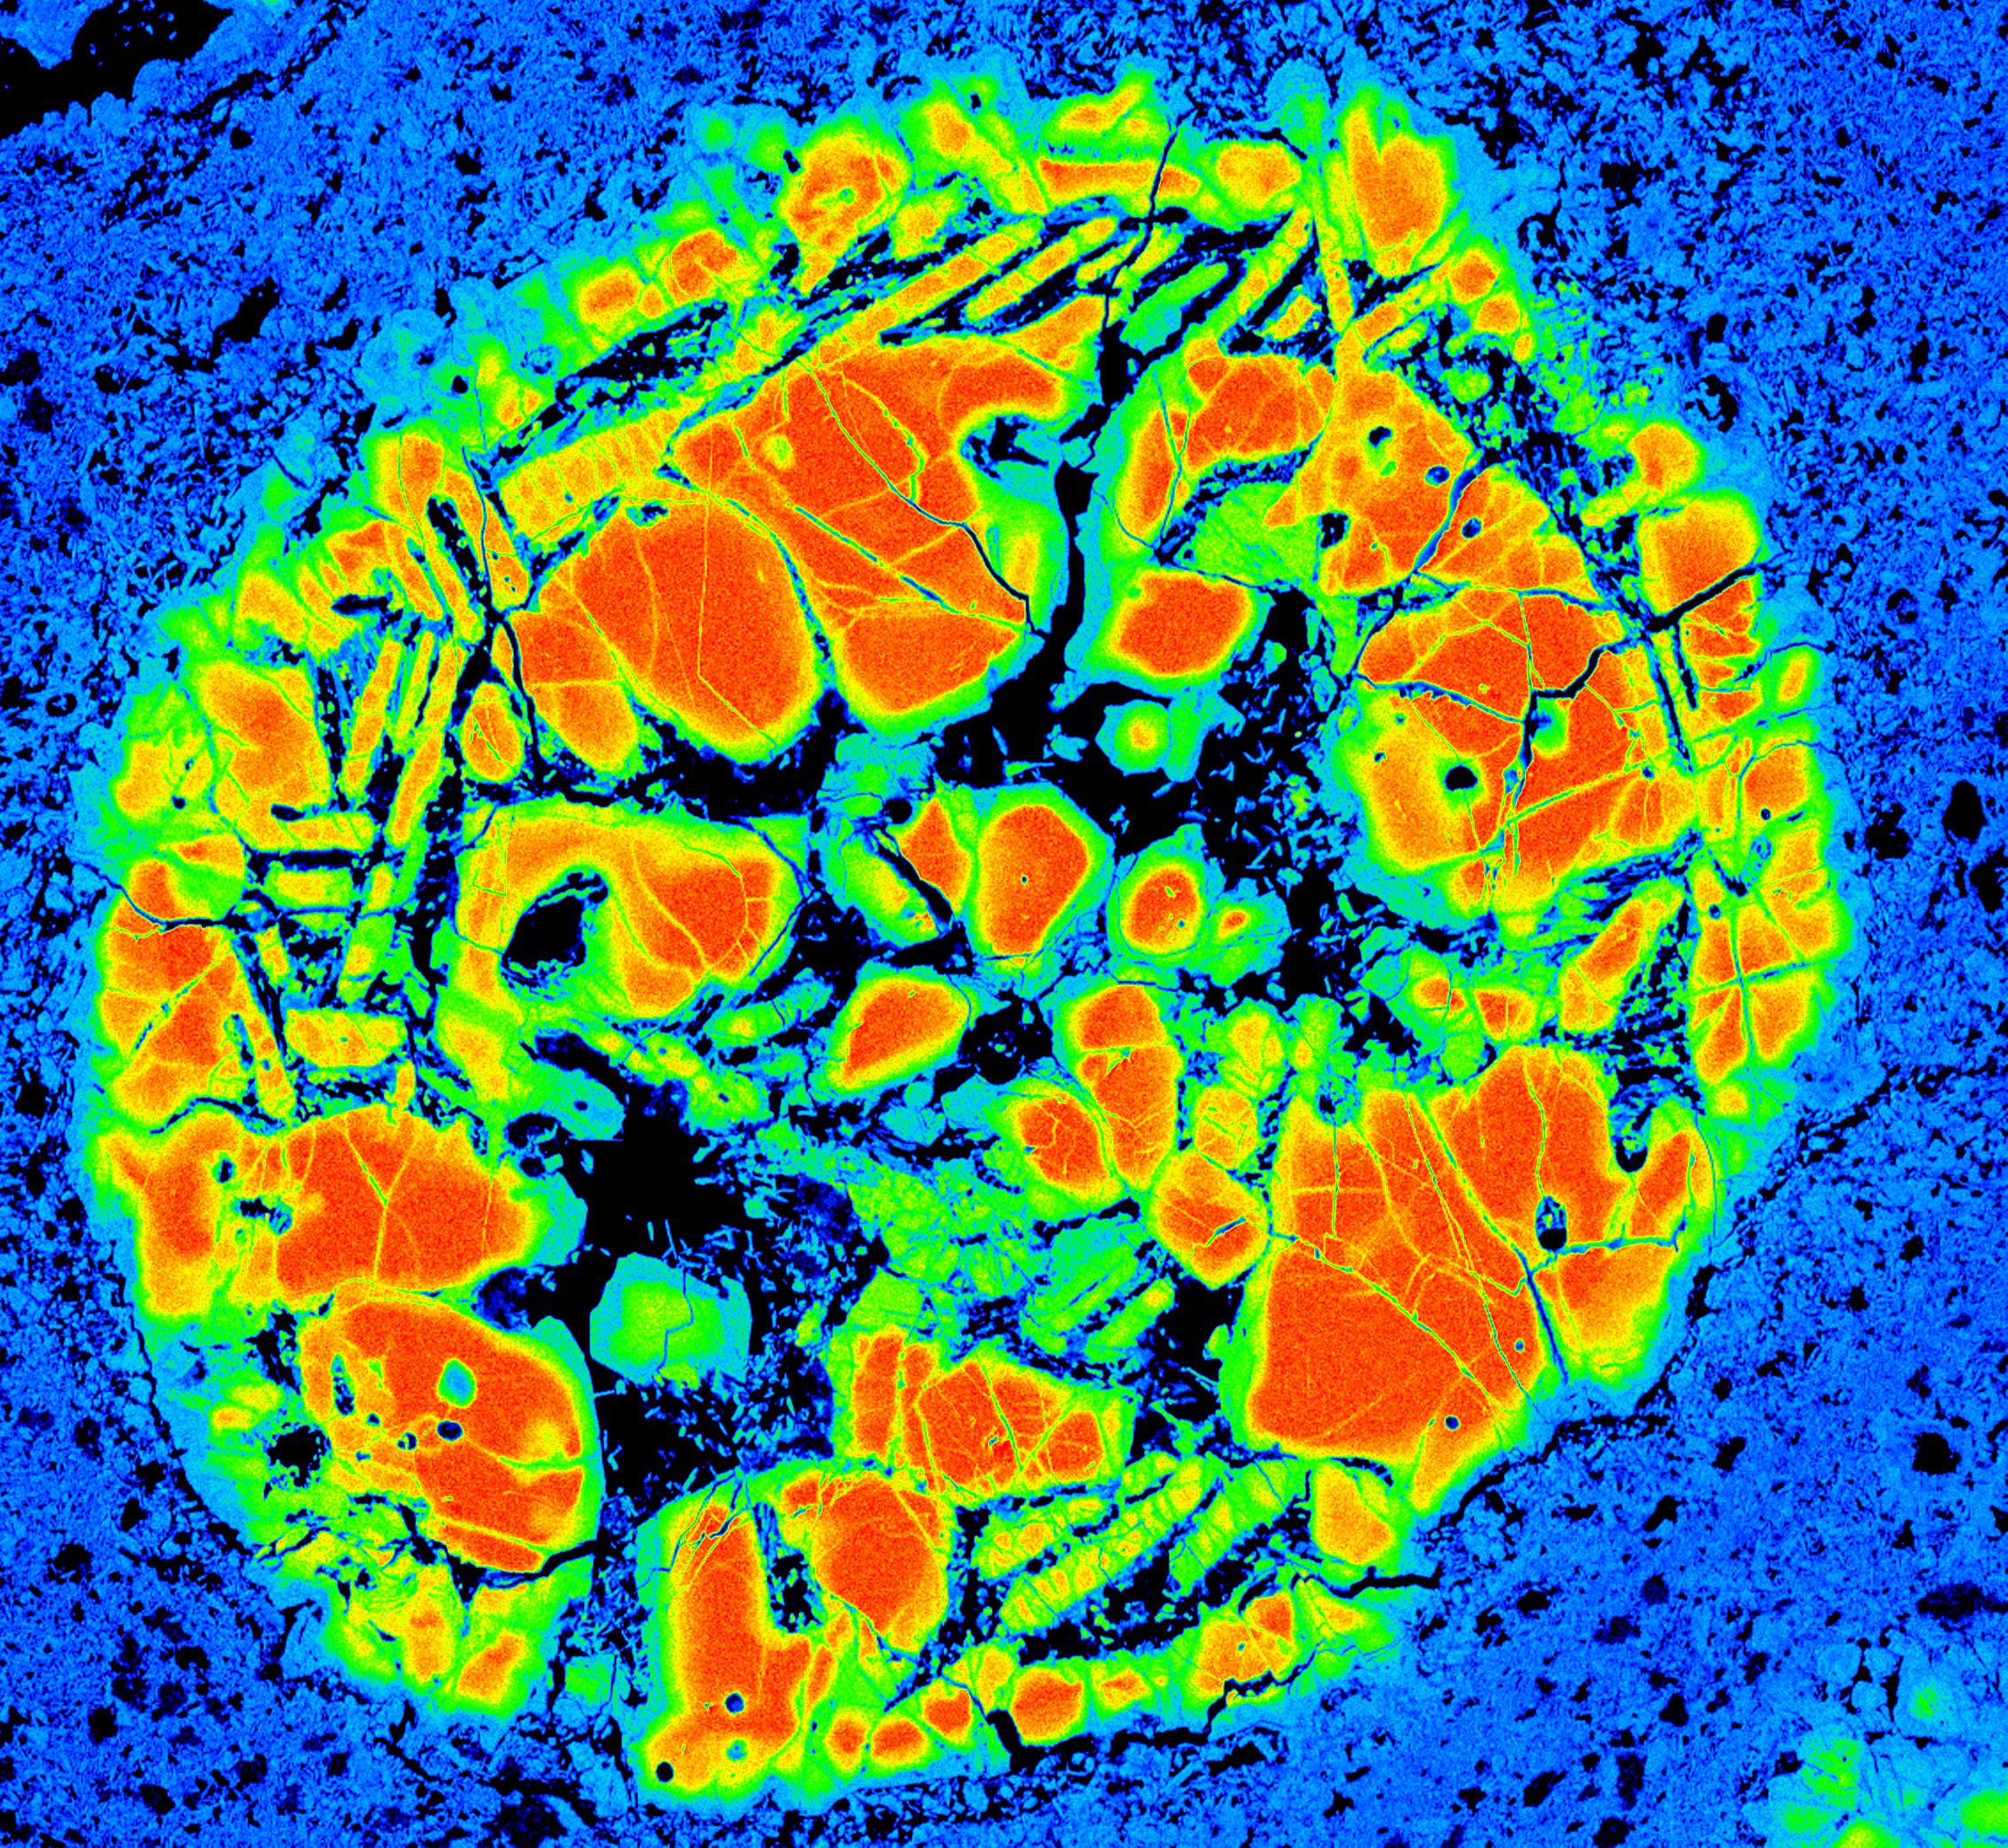
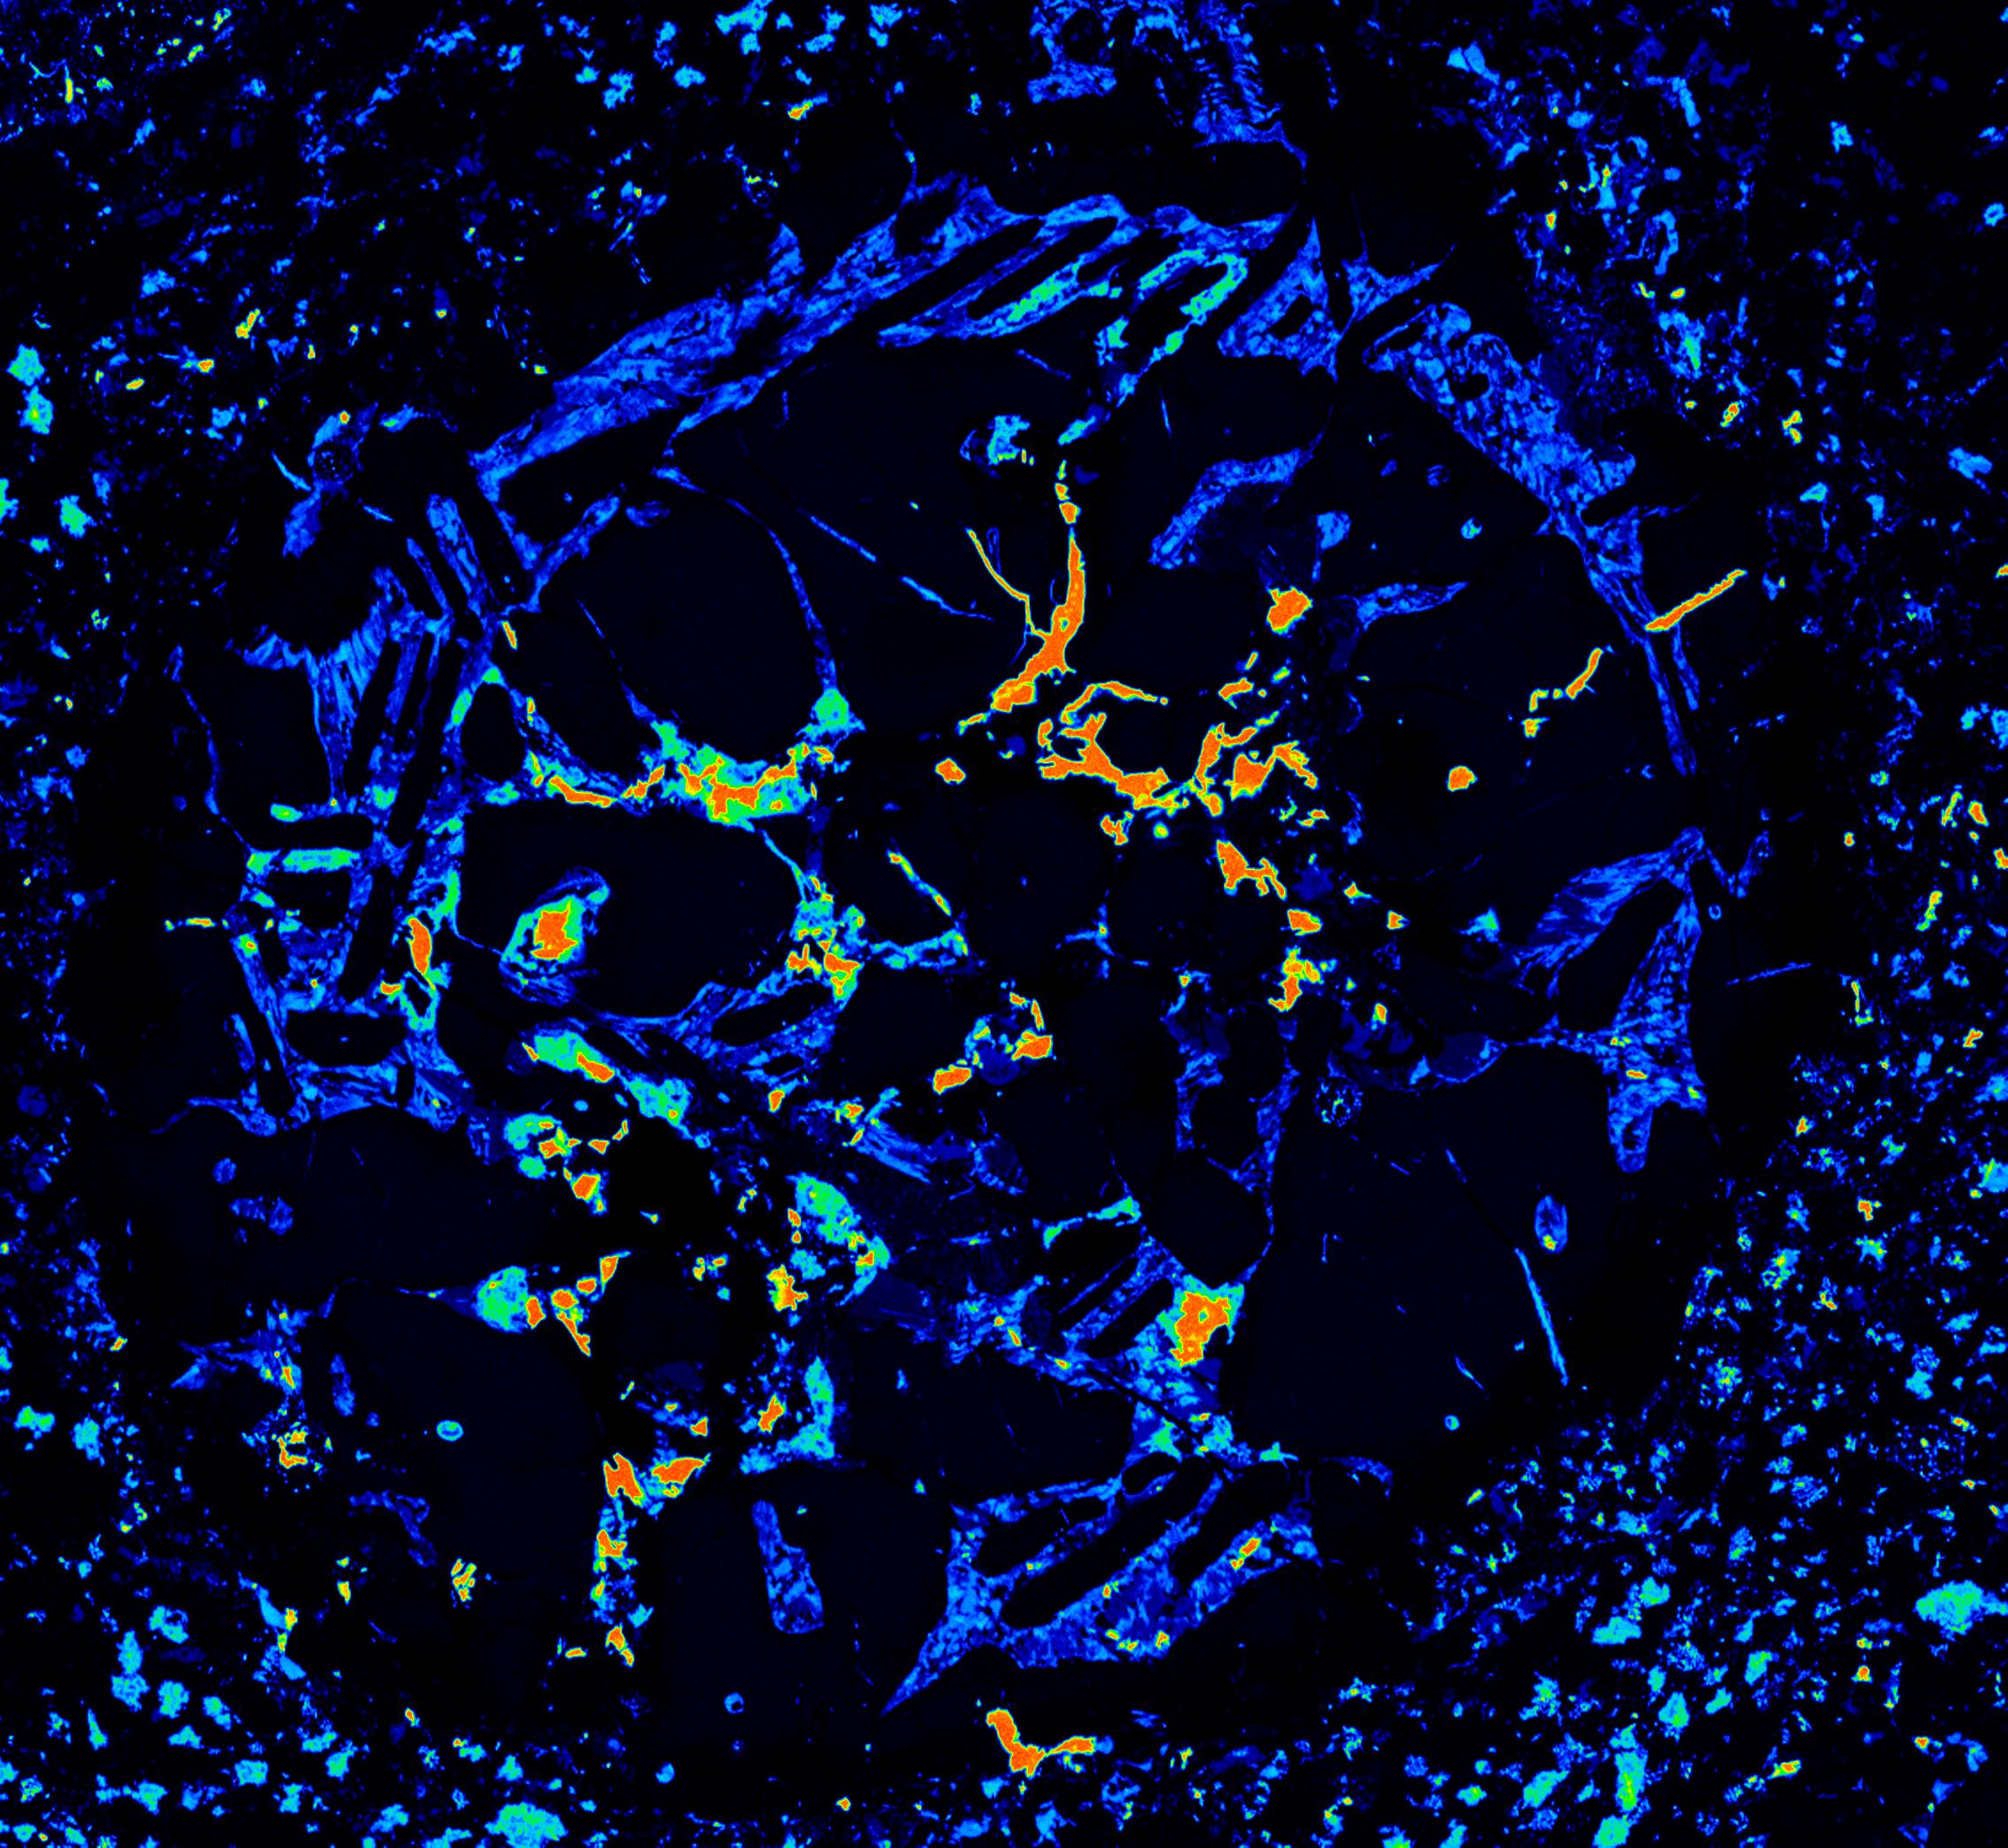
5. Mapping Applications: Zoning in Chondrites (courtesy of Royal Ontario Museum (ROM), 2021)
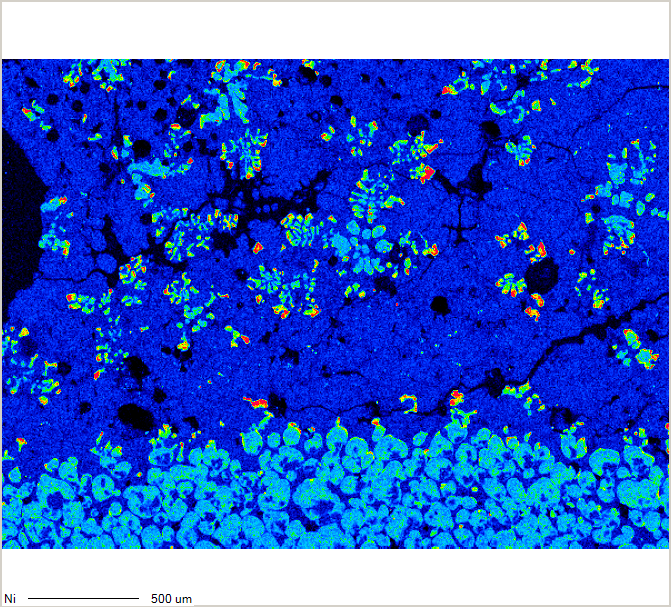
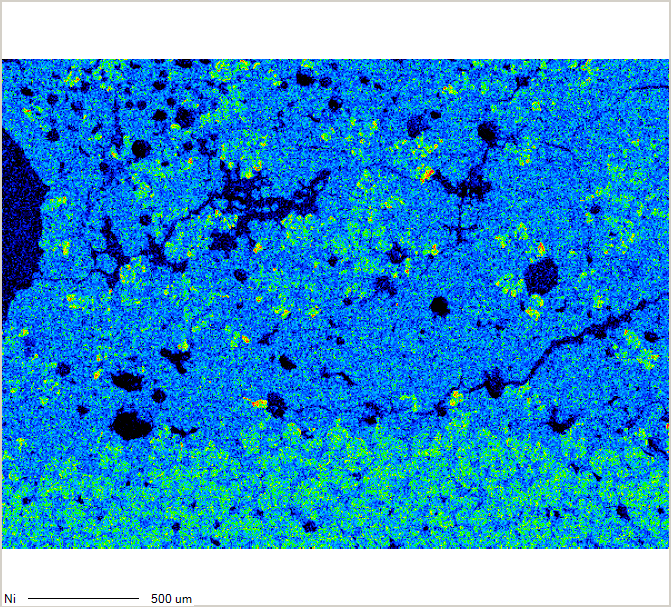
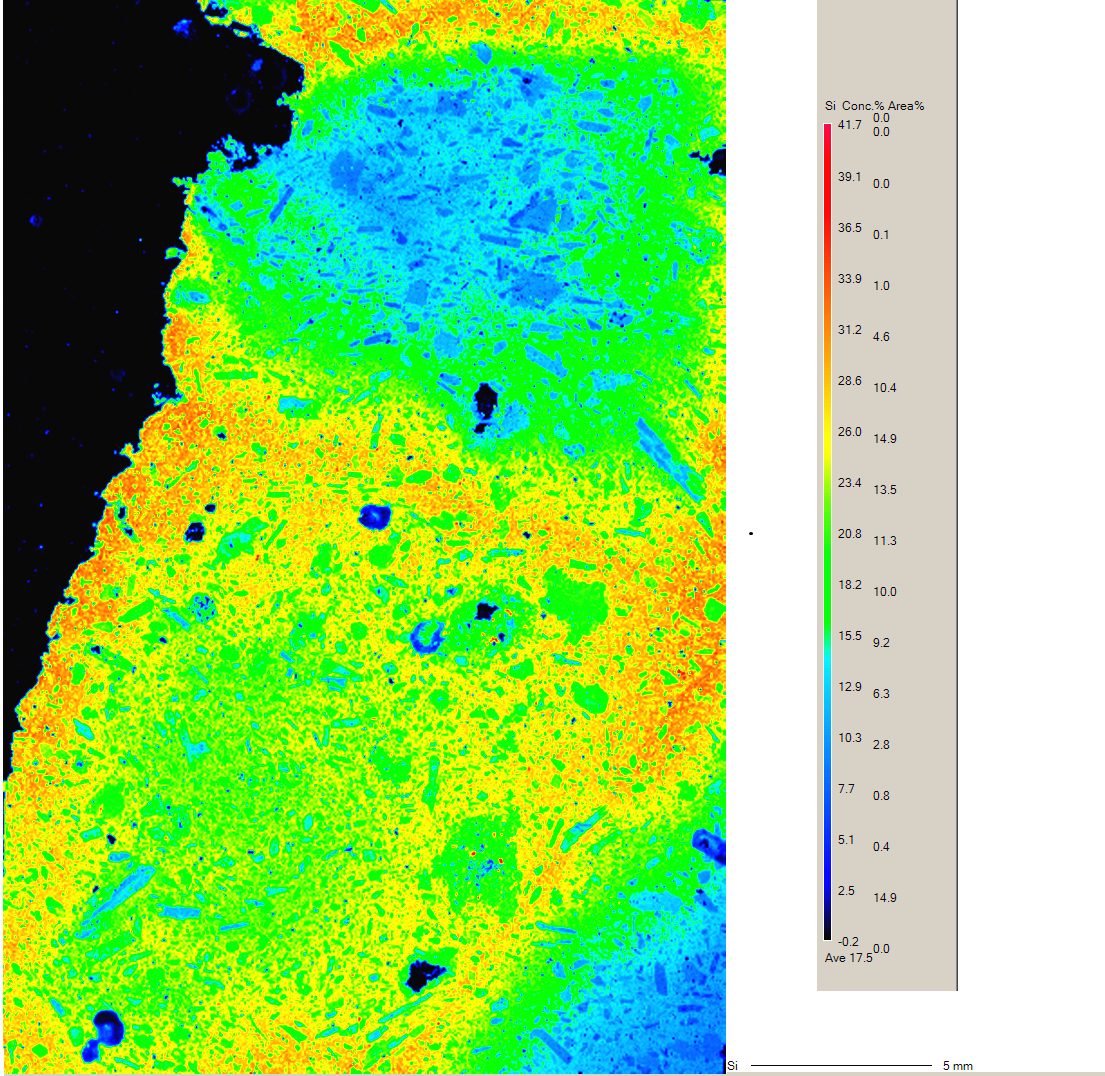
6. Mapping Applications: Nickel (Ni) Concentration
7. Mapping Applications: WDS free shape mapping on an amphibole grain ~500 microns across
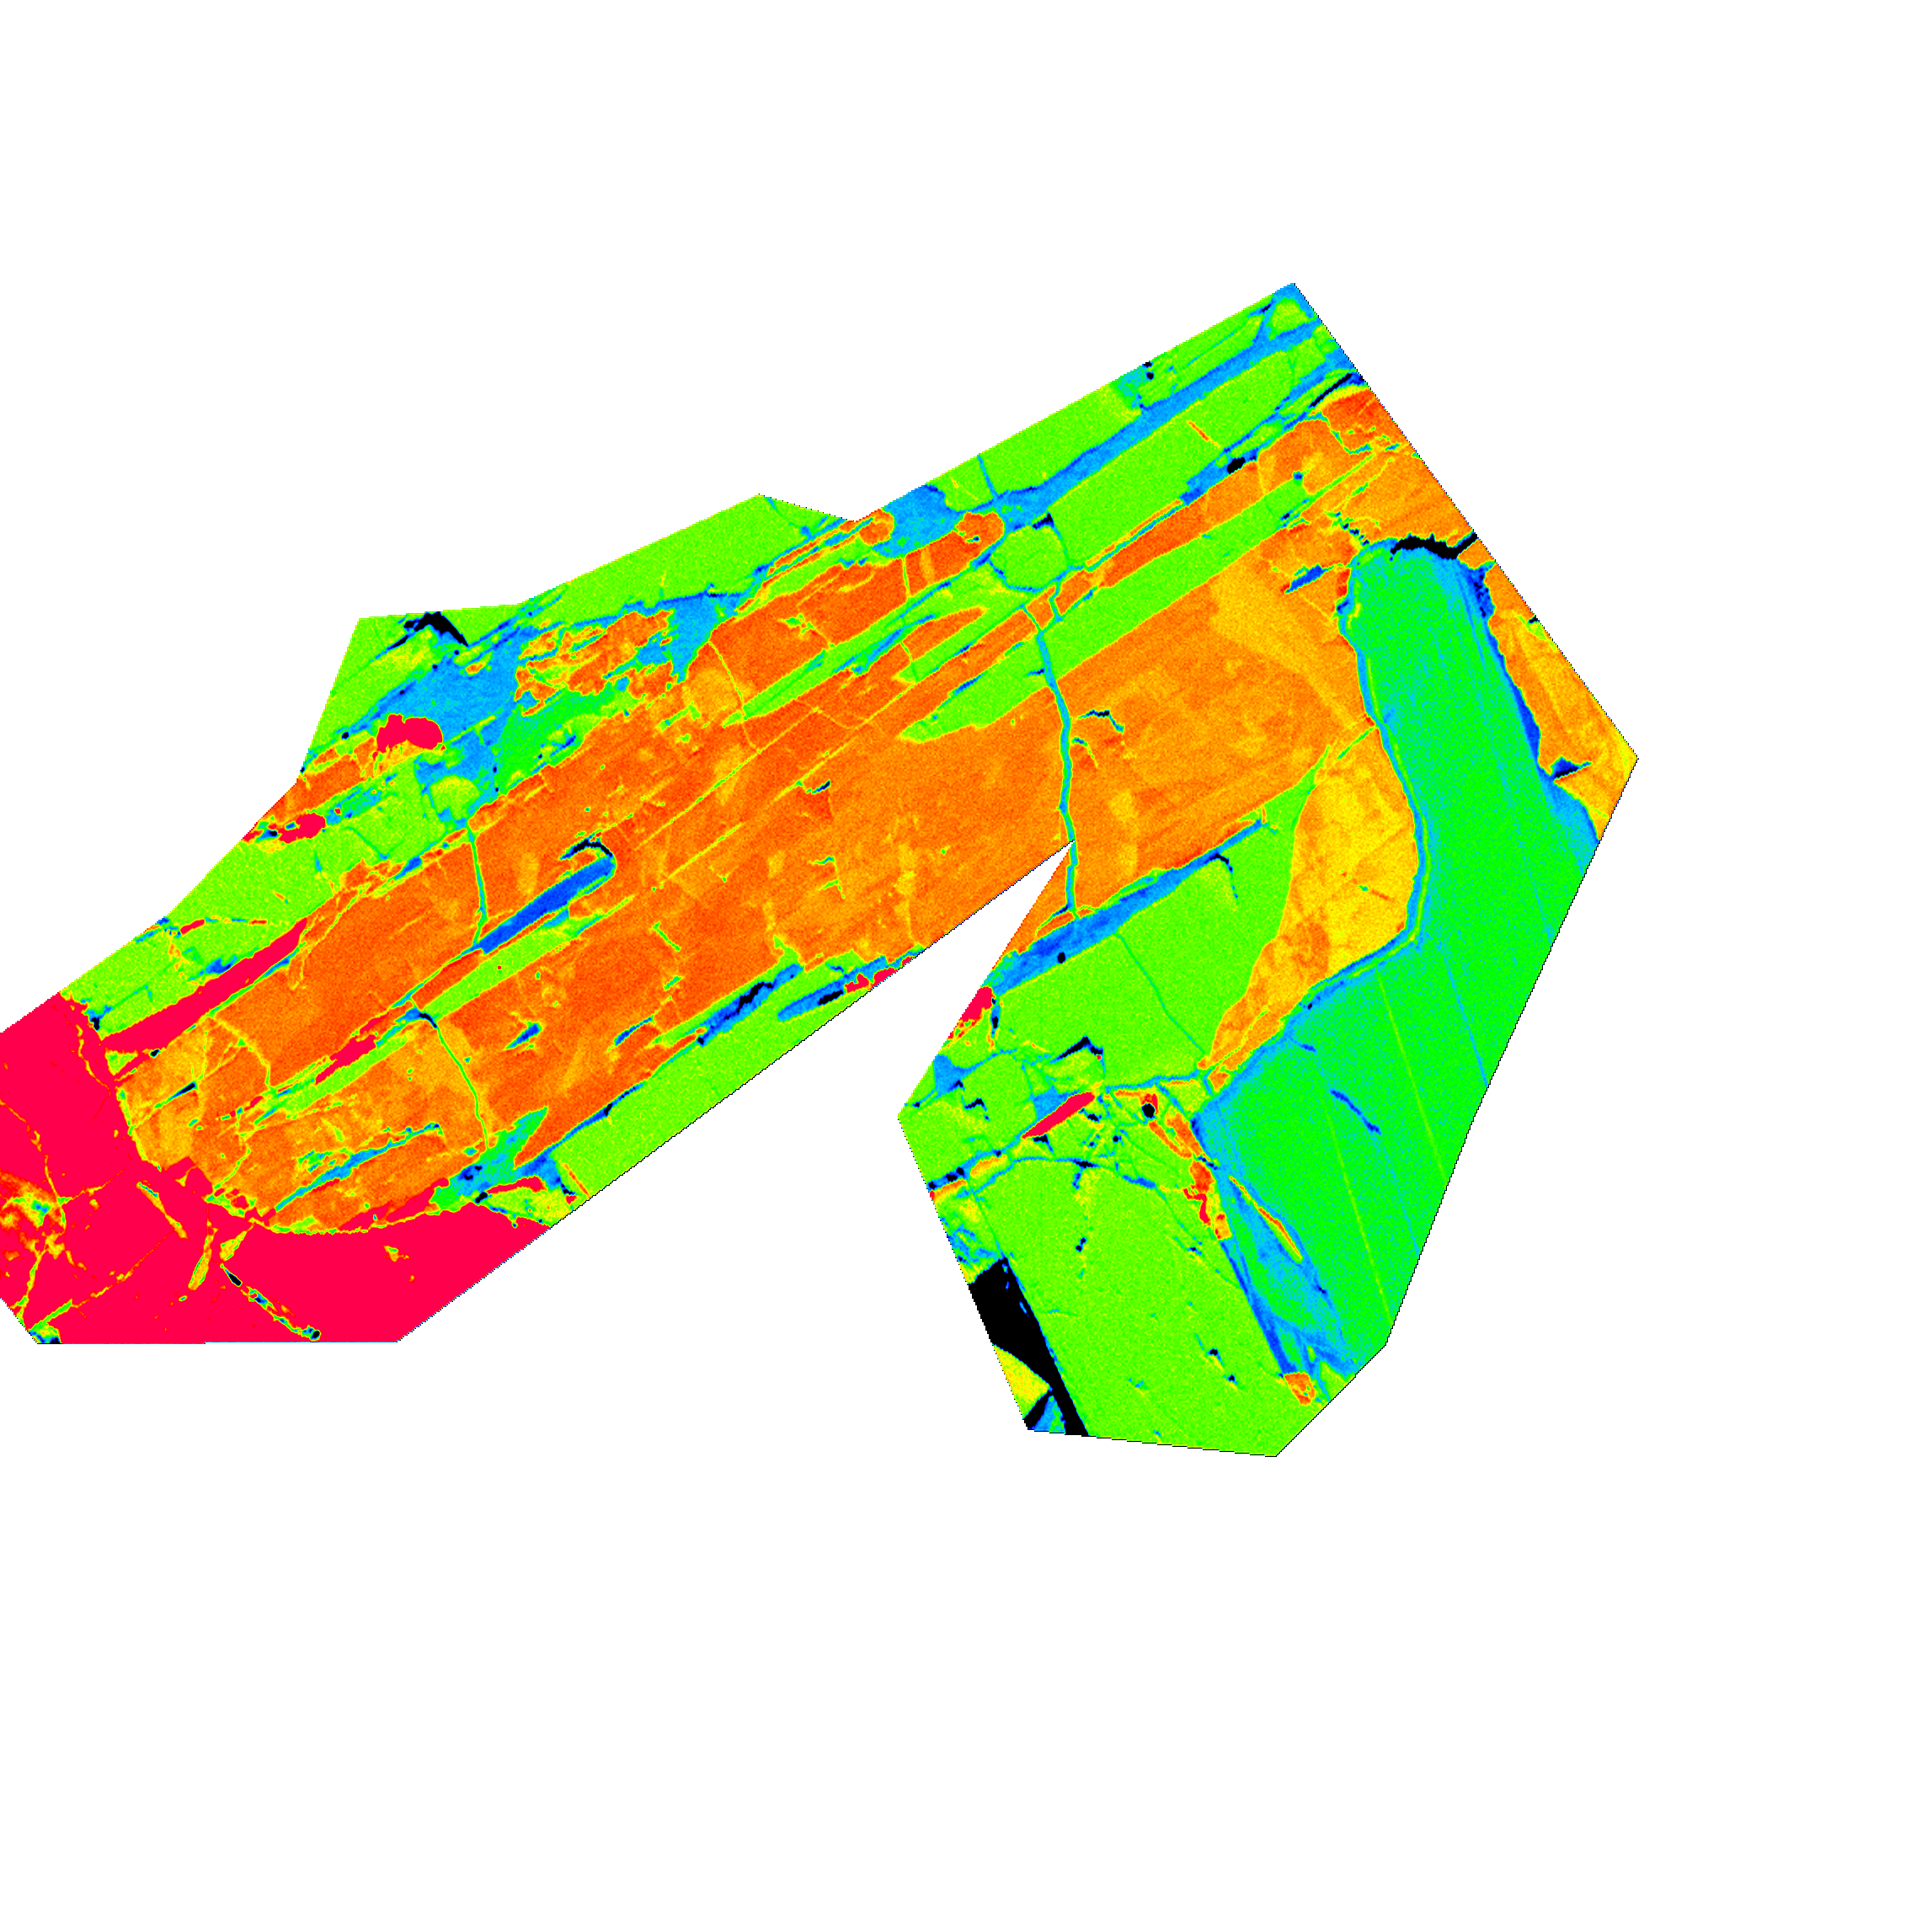
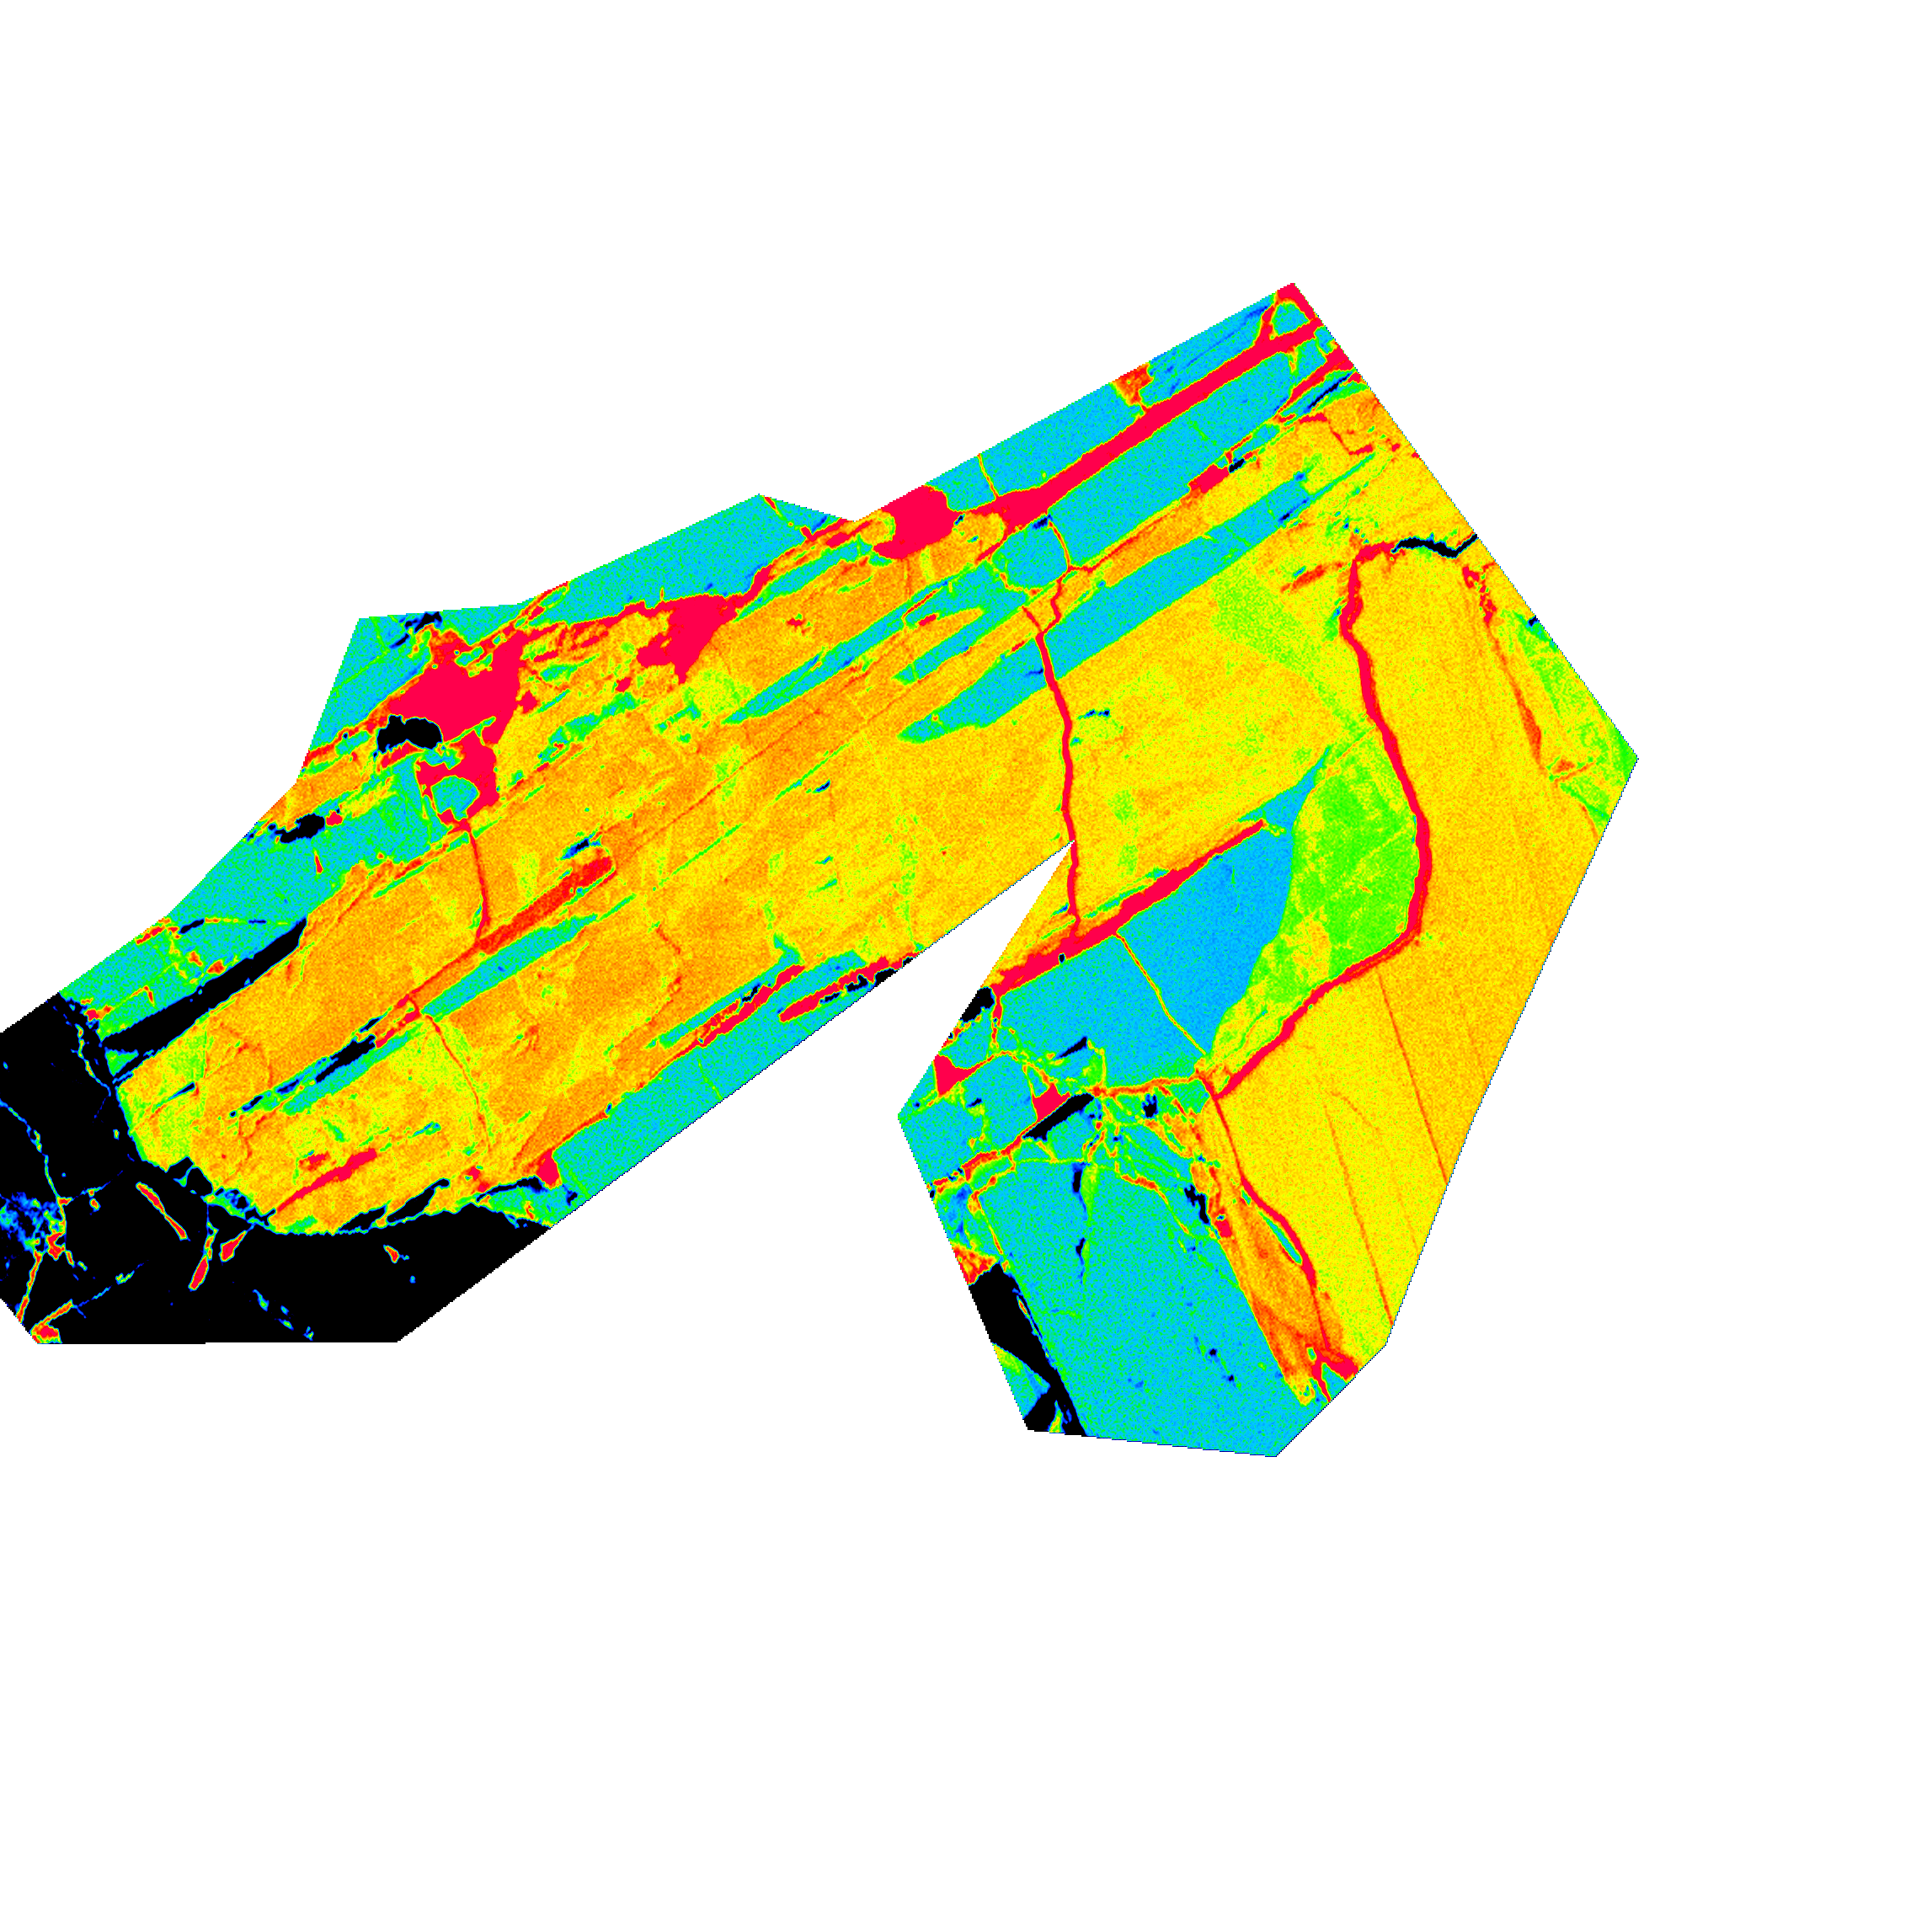
8. Example of WDS Quantitative Mapping (convertible to concentration) of the whole thin section (44 x 27 mm), ~2 hours
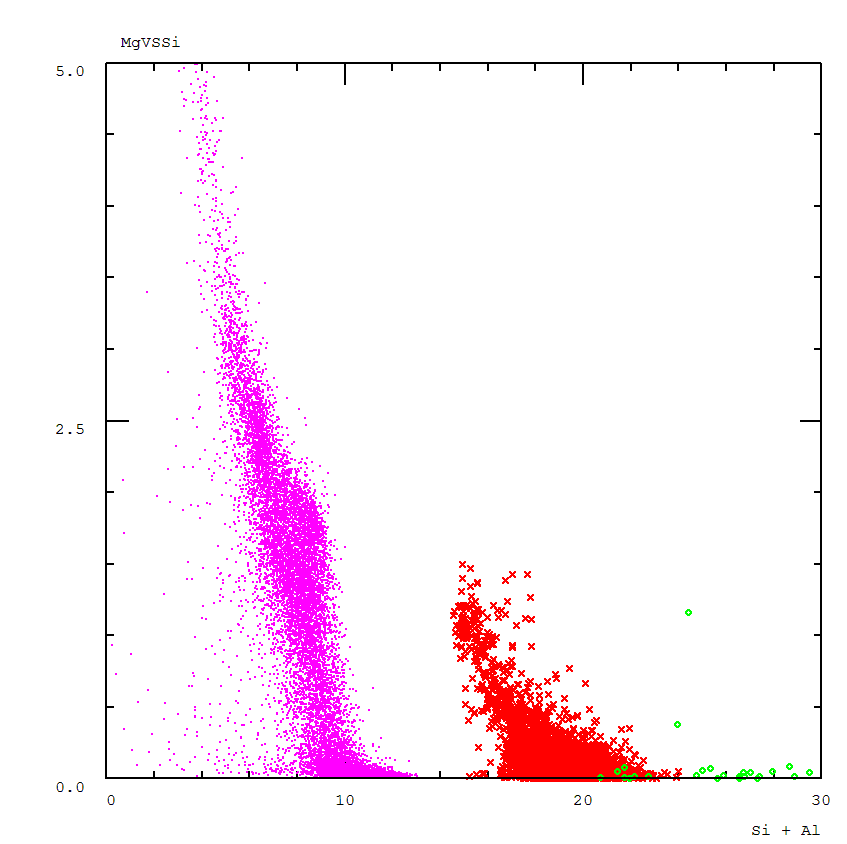
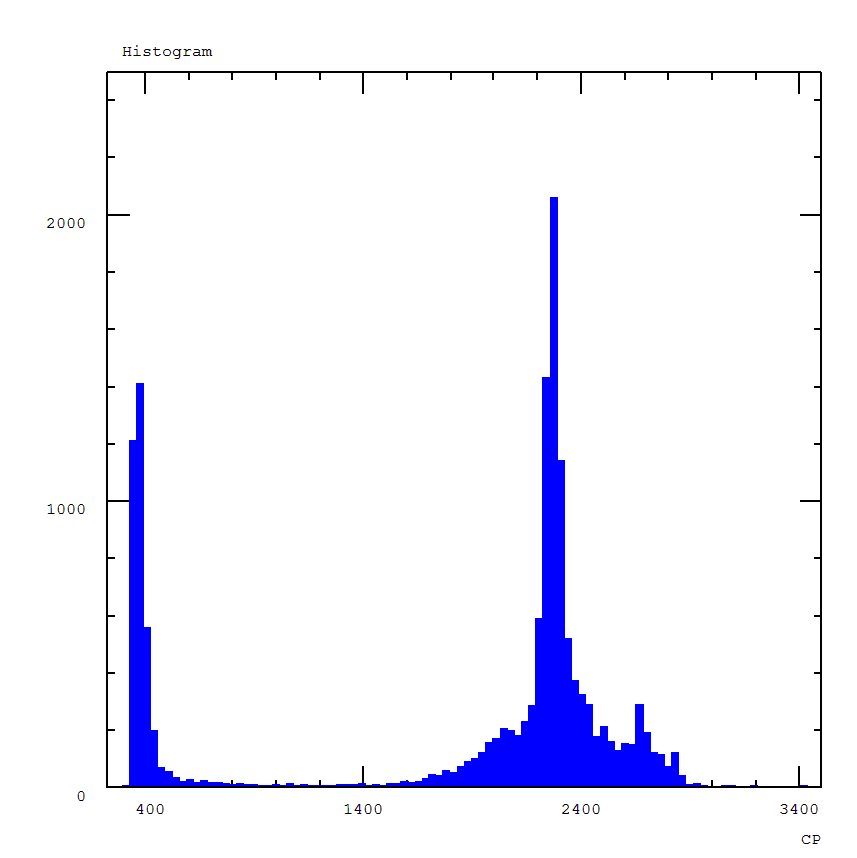
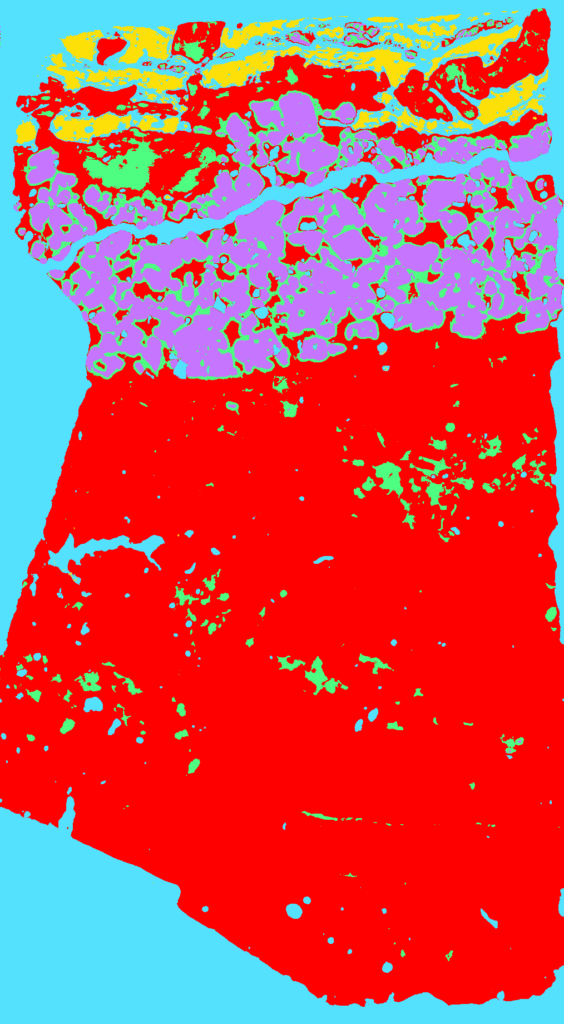
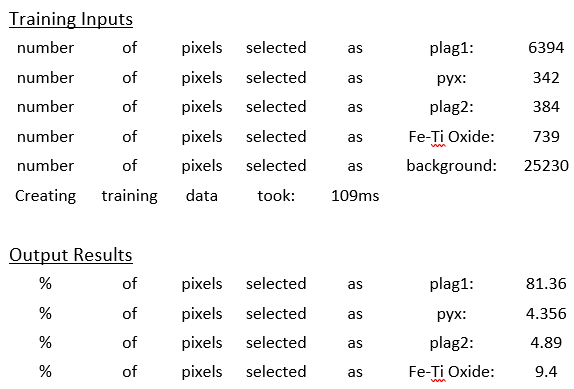
9. Phase Mapping
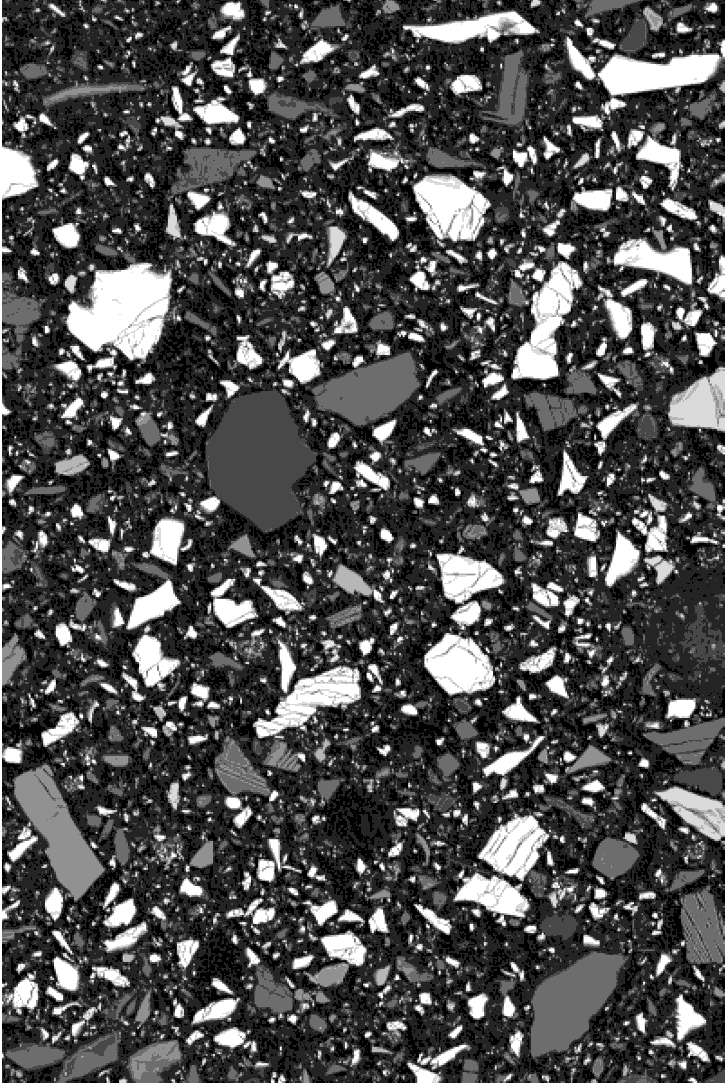
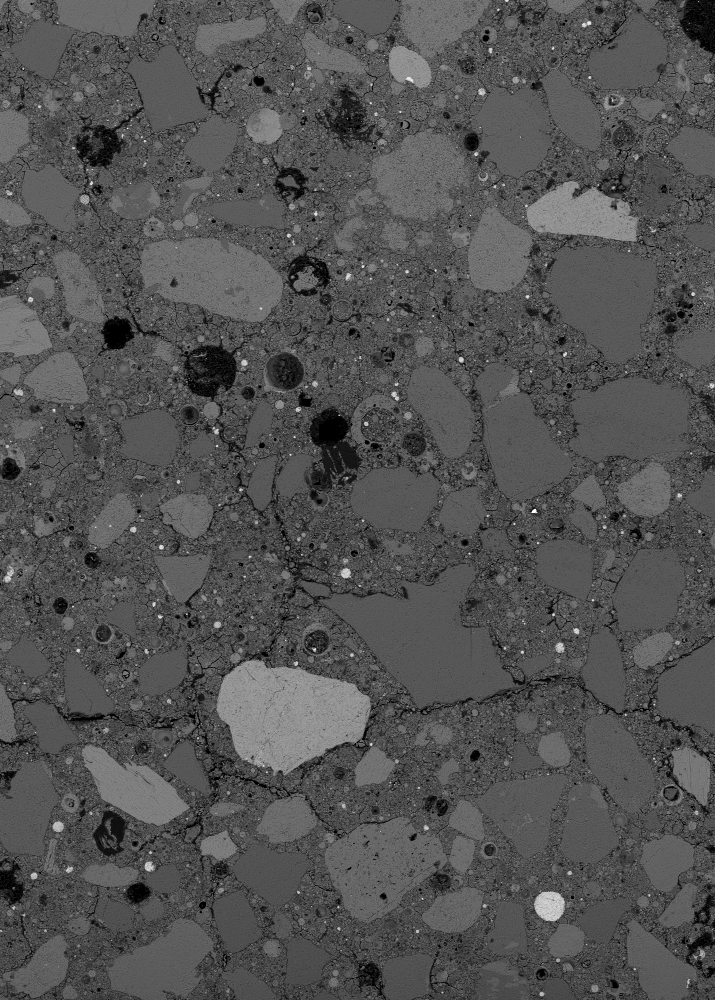
10. Particle Analysis Program: Slag/Tailing samples (Original Image)
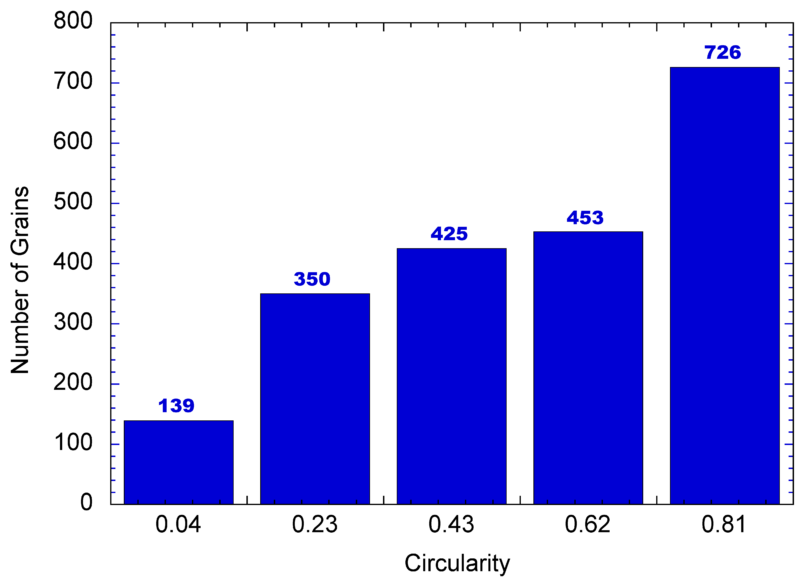
a. Automatic sorting, classifying, and counting based on size or shape parameters:
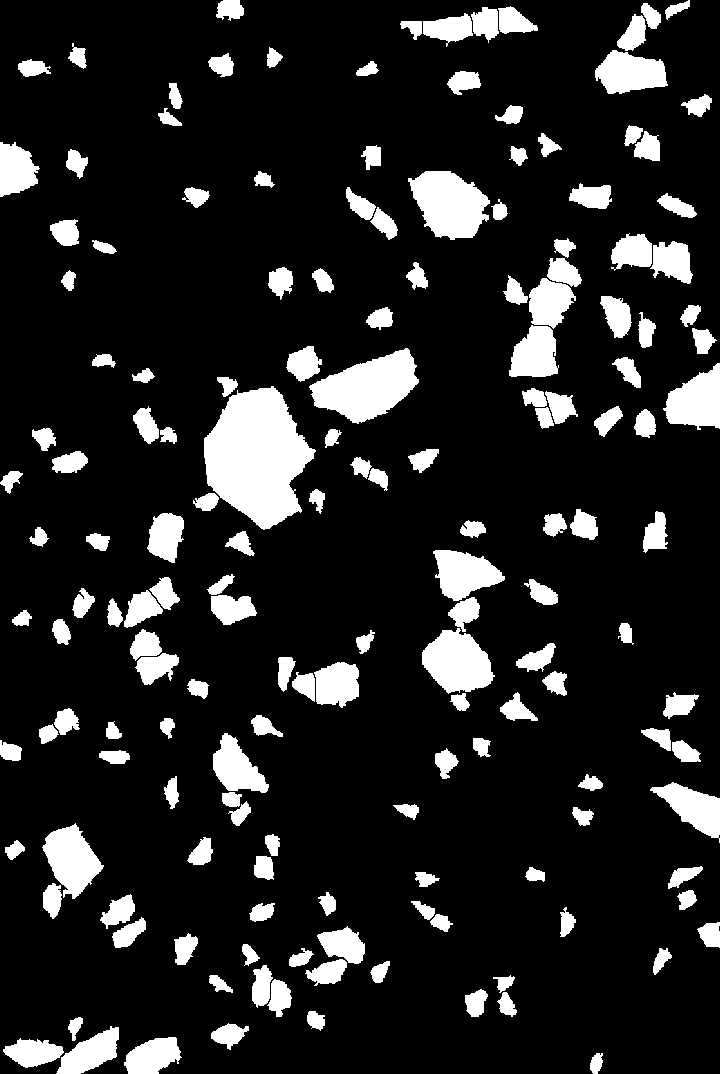
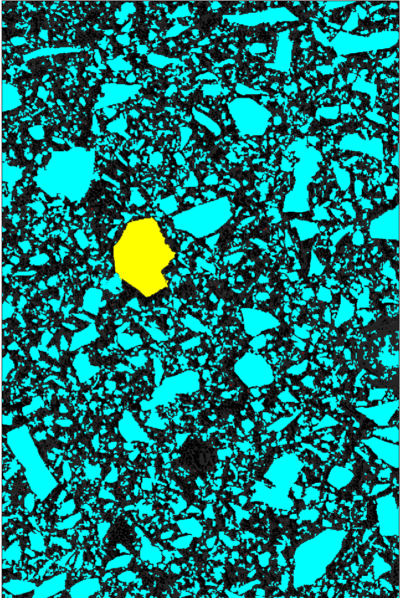
b. Extracting individual grain or feature

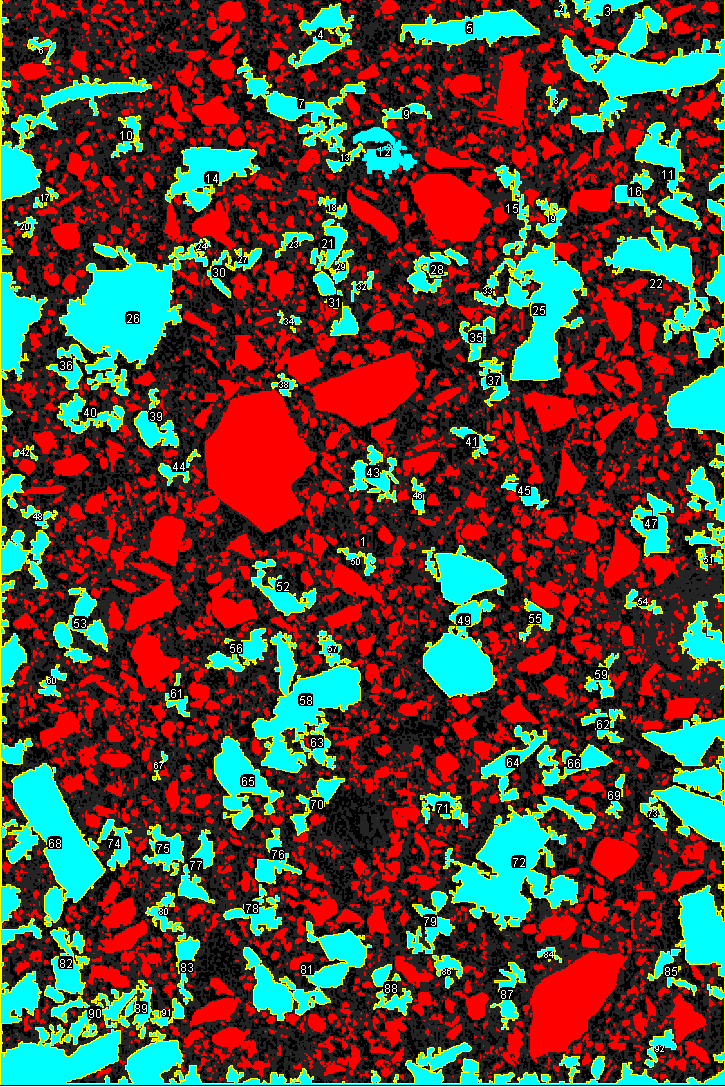
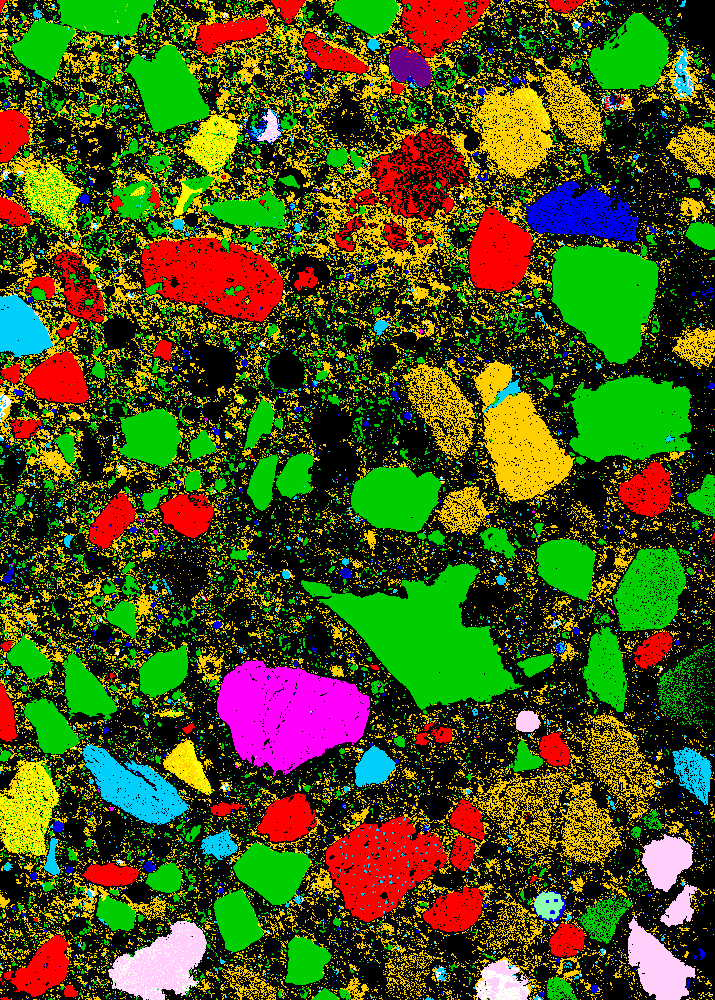
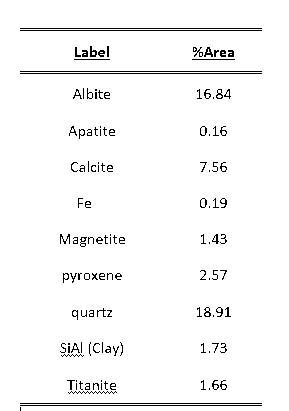
c. Automatic sorting, classifying, and counting based on phase or compositions (concrete sample):
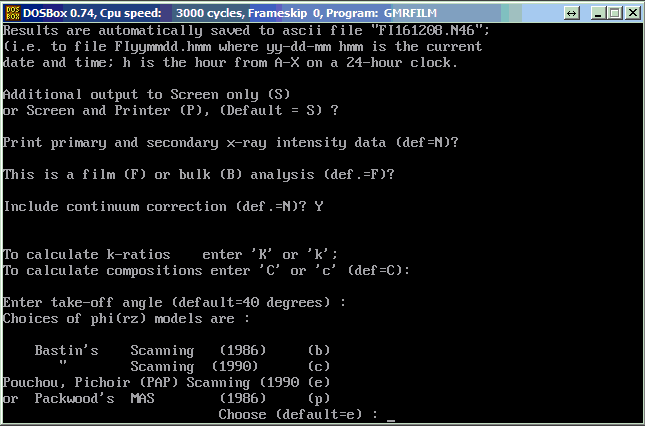
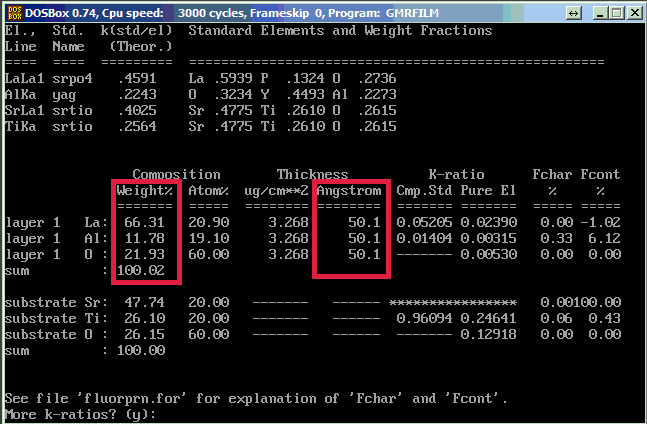
11. Film Analysis Program
a. Model film and substrate via Monte Carlo Simulation for electron ad X-ray trajectories (CASINO, PENEPMA)
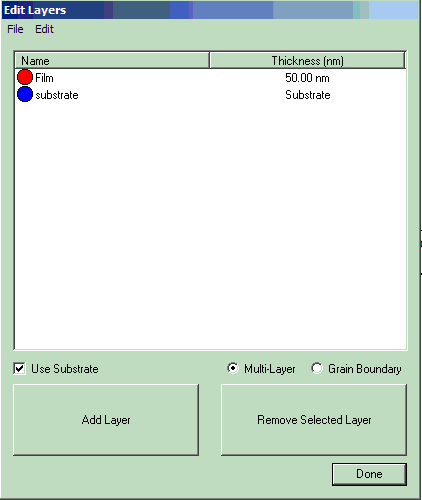

b. Calculate fil thickness and film compositions automatically from already measured K-ratios (GMRFILM)
Return to the main Gallery page.